Winter 2019 lowest rainfall?

White box eucalyptus tree

White Box Tree

There were several warm spells, mainly as warm days. The warmest was in early July, when days were 4.2° high and nights 4.0°. The only unusual daily temperatures were one high maximum of 27.1° and one low maximum of 11.3° in July.

There were 41 frosts, normally 44.
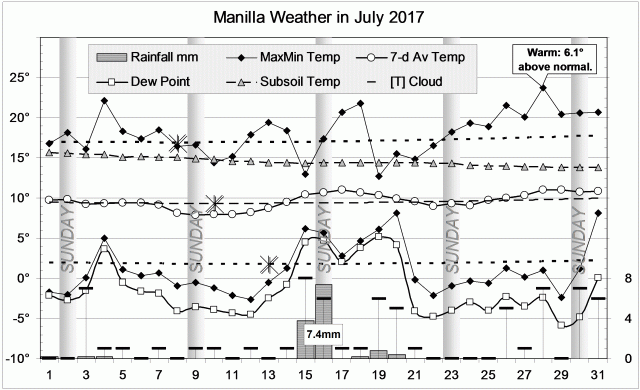
As in the drought year of 2002, there were only 8 rain days. The highest reading (estimated) was only 5.5 mm on 9 July.

Weather log winter 2019

This winter had the warmest days of the new century (19.5°) but nights that were near normal (3.2°).
Apart from the extremely low rainfall, the other moisture indicators (little cloud, low dew point, wide daily temperature range) were not as severe as in winter 2018.
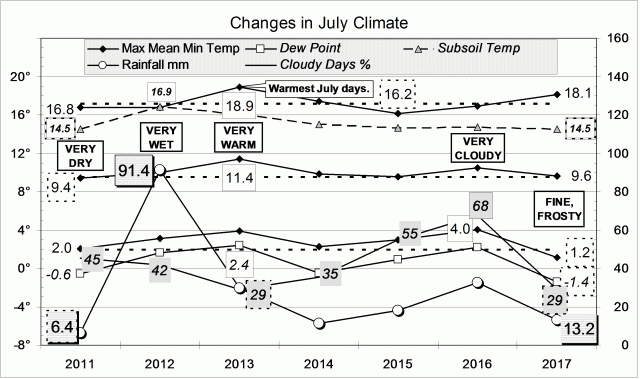
The total rainfall of 20.9 mm is the 2nd lowest on record for winter. However, it may actually be the lowest. Although the year 1888 had recorded winter rainfall of only 6 mm, there is doubt about that. Daily readings are missing for June and July. The next lowest was 1946, with 29 mm, then 1972 and 1982, both with 32 mm.

winter climate 2019


Data. A Bureau of Meteorology automatic rain gauge operates in the museum yard. From 17 March 2017, 9 am daily readings are published as Manilla Museum, Station 55312.  These reports use that rainfall data when it is available. In this season, I used my own readings until 20 July, when the Museum gauge began recording again. My estimates of early morning dew point have become anomalously low. From 1 August 2019, I use values taken from Tamworth Airport graphs at the time of minimum temperature.
All other data, including subsoil at 750 mm, are from 3 Monash Street, Manilla.

July 2017 fine with cold nights

July morning photo of Manilla from the lookout

Manilla Prospect in July

Through most of the month, days were fine and sunny, but some days, mainly in the middle, were cloudy and some had a little rain. The highest reading, on the 16th, was only 7.4 mm.
No days were remarkable except the 28th which, at 23.7°, equalled the record for July set 31/07/14. It was 6.1° above normal.
Frosts (below +2.2° in the screen) happened on 23 mornings, 6 more than normal. However, the coldest morning, at -2.6°, was not nearly as cold as the record of -5.1° set in 2002.

Weather log

Comparing July months

Unlike July 2016, which had been cloudy with warm nights, this July was fine with cold nights. Days, at 18.1°, were not quite as warm as in July 2013 (18.9°), the warmest in the new century.
Moisture was scarce, as in the record-making July of 2002. Readings that reflected low moisture were:

Daily minimum temperature very low: +1.2° (2002: 0.9°);
Very many frosts: 23 (2002: 27);
Very low percentage of cloudy mornings: 29% (2002: 23%);
Very low early morning dew point: -1.4° (2002: -1.4°);
Very wide daily temperature range: 16.9° (2002: 18.5°);
Very low rainfall: 13.2 mm (2002: 1.0 mm).

Relative humidity in the early mornings, normally 90% in July, was 74%. That was the lowest July value in my 13-year record.
Despite the total rainfall of 13.2 mm (16th percentile) being far below the July average (41 mm), there are still no shortages of rainfall for groups of months. The most recent serious shortage was nearly two years ago. In October 2015, the 30-month total to that date (1216 mm) was still down at the 6th percentile. That shortage was carried over from an earlier extreme event: the 85 mm summer rainfall of 2013-14 that was 142 mm below average.

Climate graph for July


Data. A Bureau of Meteorology automatic rain gauge operates in the museum yard. From 17 March 2017, 9 am daily readings are published as Manilla Museum, Station 55312.  These reports use that rainfall data when it is available. All other data, including subsoil at 750 mm, are from 3 Monash Street, Manilla.

November 2015 had warm days and nights

Photo of seeding clematis

“Old Man’s Beard”

By the last week of October, the weather had cooled down to normal. In November, this continued until the 15th, with rain falling on eight of the days. The highest rainfall reading was 30.0 mm on the 5th.
After that, the weather was fine. Both days and nights were warm, but no day got to 40°. The weekly average temperature reached about four degrees above normal, as it had done early in October.

Weather log November 2015

 Comparing November months

This was a warm November, by day and by night. However, November 2014 had been hotter, and November 2009 very much hotter. The average daily maximum temperature in November 2009 (34.3°) was nearly 3° higher than in this month (31.5°).
Moisture indicators for this month were close to normal, although there was not much cloud. The dew point is no longer very low, as in the last three Novembers.
The rainfall of 73.8 mm was above average, in the 63rd percentile. The climate graph still includes the phenomenally high rainfall of November 2011: 242.9 mm, the highest November rainfall since the record began in 1883. (The next highest was 226 mm in November 1961.)
There are now no serious shortages in rainfall totals for ANY number of months. For the last 30 years, Manilla has enjoyed rainfalls close to normal. The 30-year total of 19,449 mm to this date is within 100 mm from the median 30-year total of 19,360 mm. In all that time, the most extreme major rainfall events were the 2002 winter-spring drought, and the 2011-2012 summer deluge.

Climate for November 2015


Data. All data, including subsoil at 750 mm, are from 3 Monash Street, Manilla. Rainfall data up to 26/3/15 is from Manilla Post Office, Station 055031.

3-year trends to November 2015

Parametric plots of smoothed climate variables at Manilla
“November 2015: warm days and nights”

Trends to November 2015

November raw anomaly data (orange)

While November daily maximum anomalies were not as warm as in October, daily minimum anomalies were warmer (on the lower left graph). Apart from these, nearly all other climatic anomalies for November were near normal.

 Fully smoothed data (red)

The latest fully smoothed data (May 2015) completes the autumn months (MAM) of 2015. In that season, no variables were changing much. Daily maximum temperature, daily minimum temperature, subsoil temperature, and monthly rainfall were all near normal. Skies were rather cloudy, daily temperature range rather narrow and dew point (as is now usual) rather low. It seemed certain that the winter season would see a trend reversal: minimum values in the anomalies of daily maximum temperature and daily temperature range, and maximum values in the anomalies of daily minimum temperature, subsoil temperature, monthly rainfall, cloudiness, and dew point.

The three-year pattern

In these three years, a repeating annual cycle is best seen in the centre-right graph, which relates daily temperature range to daily maximum temperature. In May of each year the climate was relatively cool and equable (or maritime), while in October of each year it was relatively warm and extreme (or continental).


Note:

Fully smoothed data – Gaussian smoothing with half-width 6 months – are plotted in red, partly smoothed data uncoloured, and raw data for the last data point in orange. January data points are marked by squares.
Blue diamonds and the dashed blue rectangle show the extreme values in the fully smoothed data record since September 1999.

Normal values are based on averages for the decade from March 1999.* They appear on these graphs as a turquoise (turquoise) circle at the origin (0,0). A range of anomalies called “normal” is shown by a dashed rectangle in aqua (aqua). For values in degrees, the assigned normal range is +/-0.7°; for cloudiness, +/-7%; for monthly rainfall, +/-14 mm.

 * Normal values for rainfall are based on averages for the 125 years beginning 1883.

October 2015 very warm

Photo of native jasmine

Sweetest Jasmine

The first 30-degree day of the season came on the 3rd. That was ten days late, but the first 35-degree day followed soon after, on the 6th. Most days and nights were warm through the month, and the weekly mean temperature was three or four degrees above normal until the last week.
Ten sunny days were followed by days with much more cloud, and four rain days (usually seven). On the 22nd and 23rd, I recorded 17.4 and 8.0 mm.

Weather log for October

 Comparing October months

This was the warmest October of the new century for all daily temperatures: maximum, mean and minimum. The mean temperature of 21.7° was 3° above average, and much higher than in the other warm Octobers of 2014 (20.6°) and 2007 (20.4°).
The graph shows the curious fact that October months have warmed steadily since 2011. Since 2012, Octobers have not become drier: rainfall, cloudiness and humidity have increased rather than decreased.
The rainfall of 35.0 mm was below average, in the 29th percentile. As in last month’s report, there are no serious shortages in rainfall totals for small numbers of months. The only serious shortages are in the 30 month total (6th percentile) and in the 42 month total (7th percentile). There are still deep ponds in Greenhatch Creek.

Climate for October 2015


Data. All data, including subsoil at 750 mm, are from 3 Monash Street, Manilla. Rainfall data up to 26/3/15 is from Manilla Post Office, Station 055031.