Hot and dry records in January 2019

In January 2019, the smoothed anomaly value of monthly rainfall reached a record low (-31.8 mm/month), and that of monthly mean maximum temperature a record high (+1.79°).

Rainfall and temperature trajectory Sep2016 toFeb 2019

[This graph is extracted from a forthcoming post in the series “3-year trends…”. ]

This graph shows temperature and rainfall anomalies, not raw data. It shows how far the actual values differ from normal. The 30 data points from September 2016 to February 2019 (coloured red) are smoothed to show only cycles longer than one year.

The earliest data point, September 2016, had temperature and rainfall just beyond the normal range on the cool and wet side (lower left). Since that date, all the smoothed data points have fallen close to the sloping Mackellar trend line (blue) from cool-wet to hot-dry. (See the note below: Mackellar trend line.)
In the 4 months up to January 2017, warming and drying was rapid, passing completely through the “normal” range. Next, some cooling and wetting occurred to May 2017, then warming and drying resumed to a full drought in March 2018. Through the year 2018, drought prevailed, with a rainfall anomaly always below -25 mm. The temperature anomaly fell to only +1 deg by August, but rose again while rainfall fell. Records for low rainfall and high temperature were broken repeatedly.
January 2019 had the lowest smoothed monthly rainfall anomaly of the 21st century (-31.8 mm/month), and the highest monthly mean maximum temperature (+1.79°).
The following month, February 2019, had a slightly decreased temperature anomaly, and an increased rainfall anomaly. Later data points with less smoothing applied suggest that the smoothed record values of January may stand for some time.


Note.

Mackellar trend line

The insight of Dorothea Mackellar that this is a land “of droughts and flooding rains” *
is expressed in these graphs by a blue trend line passing through the “Normal” point in the centre (aqua) and extending both to “Droughts” with high temperature and low rainfall at the top right and to “Flooding Rains” with low temperature and high rainfall at the bottom left. Smoothed data points for anomalies of mean monthly daily maximum temperature and monthly rainfall totals generally lie close to the sloping blue line in such graphs for all of the last 20 years. (Search “3-year climate trends”, this one, for example).

Notice that record high and low values of smoothed anomalies of rainfall and daily maximum temperature (dates marked in blue) lie close the this blue line, supporting the estimate.
Empirically, one degree of increase in temperature anomaly matches 20 mm of decrease in monthly rainfall anomaly: the Mackellar Constant for Manilla is -20mm/month/degree.

* By arrangement with the Licensor, The Dorothea Mackellar Estate, c/- Curtis Brown (Aust) Pty Ltd.

21-C Rain-ENSO-IPO: Line graphs

From 1999, rainfall at Manilla NSW matched ENSO only up to 2011, before the IPO became positive.

Manilla rain, ENSO, IPO

This graphical log compares the rainfall at Manilla NSW with the El Niño-Southern Oscillation (ENSO) and the Inter-decadal Pacific Oscillation (IPO) through the 21st century to date. Values shown are anomalies, smoothed. (See Notes below on “Data”, “Smoothing”, and “Lagged Rainfall”.)

Rainfall (black) uses the left axis scale; the ENSO (magenta) and the IPO (green) use the inverted right axis scale.

[21st century temperature and rainfall at Manilla are compared as smoothed data in the post “21-C Climate: Mackellar cycles”.]

Matches between rainfall and ENSO

There is an excellent match between the rainfall and ENSO values in the left part of the graph.
I improved the visual match by various means:
1. The ENSO scale (magenta) is inverted, because positive values of the ENSO anomaly relate to negative values of rainfall anomaly here.
2. The scales are harmonised: the zero values are aligned, and 20 mm of monthly rainfall anomaly is scaled to (minus) one degree of ENSO anomaly.
3. Smoothing is applied to suppress cycles shorter than 12 months.
4. Rainfall anomaly values are lagged by two months. (See the Note below.)
As lagged, most peaks and troughs of rainfall coincide with troughs and peaks of ENSO, and their sizes (as scaled) are often similar.

Failure to match rainfall and ENSO

In the right part of the graph, the match between rainfall and ENSO fails. There are extreme mismatches: the Super-El Niño of 2014-16 had no effect on local rainfall, the rainfall deluge of 2011-12 came with a mild and declining La Niña, and the extreme drought of 2018 came while ENSO was neutral.
By visual inspection, I judge that a close relation of rainfall to ENSO, which had applied for the twelve years up to September 2011, then failed for the following seven years.

Influence of the IPO

The inter-decadal Pacific Oscillation (IPO) affects the relation between ENSO and Australian weather. (See note below “Effect of the IPO”.)

Power et al.(1999) show that Australian seasonal weather and its prediction align with ENSO only when the IPO is negative. It follows that a good match between ENSO and Manilla rainfall was expected while the IPO (green) was negative from 1999 to 2013, and was not expected from 2014 to 2017. The trend of the IPO through 2016-17 makes it likely that the IPO continued positive through 2018, as the mismatch between rainfall and ENSO persisted.
Power et al. note that the relation is not sensitive to the width of a neutral zone chosen to separate the positive and negative regimens of the IPO. In this particular case, the rainfall/ENSO match failed as the IPO rose through minus one degrees. However, the rainfall/ENSO match began in 1999, much earlier than the time when the IPO fell through minus one degrees.

Scatter plots

In a following post I show scatter plots and regressions for the periods of match and mismatch on this graphical log.


NOTES

Data

Rainfall

Continue reading

21-C Climate: Mackellar cycles

At Manilla, NSW, the anomaly of daily maximum temperature has continued to track, in the opposite sense, that of monthly rainfall.

Graphical log of smoothed rainfall and temperature.

The values shown are anomalies from normal values, smoothed to suppress cycles shorter than 12 months. (See notes below on Normals and Smoothing.)

The pattern is of quasi-biennial cycles that express the insight of Dorothea Mackellar that this is a land “of droughts and flooding rains*. Hot dry times alternate with cool wet times. For temperature, I have chosen the mean daily maximum, as it best matches the rainfall.

This post updates others in the Menu Category “Manilla NSW/21st century climate/Anomalies smoothed”, such as “17 years of ‘Droughts and Flooding Rains’ at Manilla” (29/06/2014).

“Droughts” (hot dry times)

Winter-spring 2002. The drought of 2002 was extreme, having rainfall in the lowest 1% in history. Lowest rainfall anomaly was in the winter and highest temperature anomaly in the spring.

Spring 2009. The temperature anomaly in spring 2009 was as high as in 2002, but the rainfall (as smoothed) barely qualified as “drought”.

Spring-summer 2013. The maximum temperature anomaly in spring 2013 was again like that in 2002 and 2009. This time, the rainfall minimum came later, in the summer. The drought was severe but not extreme.

Autumn-winter 2018. The temperature anomaly peak was higher than the earlier peaks. The minimum rainfall anomaly that followed in the winter was again extreme.

Summer 2018-19. At this time, the temperature anomaly was the highest, and the rainfall anomaly the lowest on this graph.

“Flooding Rains” (cool wet times)

Spring 2005. The spring of 2005 was wet, but the temperature was not cool but rather warm.

Summer 2007-8. Although the summer of 2007-8 was cool, rainfall was normal. Continue reading

Drought Sixth Month: August 2018

Rainfall status, July and August 2018.

Graph of Rainfall Shortages

This graph shows all the present rainfall shortages at Manilla, short term and long term, in terms of percentile values. The latest values, as at the end of August, are shown by a black line with black circles. Those from one month earlier, at the end of July, are shown by a thinner line with smaller white circles.
The classes of rainfall shortage are:
• Serious shortage: below the 10th percentile;
• Severe shortage: below the 5th percentile;
• Extreme shortage: below the 1st percentile. [See note below on my usage “Extreme shortage”.]

Changes this month

Rain late in August raised the one month and two month rainfall totals out of the class of “serious shortage”. The total for August (28.2 mm) is at the 40th percentile for the month, and the total for July and August is at the 10th percentile. The three-month total, which had been an extreme shortage, fell to become only a severe shortage.

Extreme shortages

Extreme shortages, seen less than 1% of the time since 1883, are now seen for the durations of 4, 5, 6, and 15 months. Without last week’s rain, the 6 month total would have been one of the lowest ever recorded.
There is an extreme shortage at 15 months, due to low rainfall in mid-2017, in the months of July (13.2 mm), August (13.8 mm), and September (5.5 mm).

Long-term shortages

The 6-year rainfall total for August (3252 mm) is a severe shortage, only slightly above that of July (3234 mm). Both these values are lower than any 6-year rainfall totals since 1962. When rainfall shortages of such long duration persist, rainfall does not maintain the groundwater levels or river flows required for irrigation or town supply.

[A graph showing rainfall shortages to the end of September 2018 is in the later post: “Record 15-month Drought in 2018”.]


Note: The term “Extreme shortage”

I have adopted classes of rainfall shortage from the classes of “Rainfall deficiency” defined by the Bureau of Meteorology in their Climate Glossary as follows:

“Serious rainfall deficiency: rainfall lies above the lowest five per cent of recorded rainfall but below the lowest ten per cent (decile range 1) for the period in question,
“Severe rainfall deficiency: rainfall is among the lowest five per cent for the period in question.
“Areas where the rainfall is lowest on record for the given time period are also shown.”

The Manilla rainfall record allows me to be more exact than the Bureau. Because the record extends back 134 years, it includes more than 1200 cumulative monthly rainfall values. I can identify percentile ranks even below the 0.1th percentile.
To the Bureau’s two classes of deficiency I add a third:

“Extreme deficiency (or extreme shortage): rainfall lies below the lowest one percent for the period in question.”

Drought Fifth Month: July 2018

Rainfall status June and July 2018

Rainfall shortages at June and July 2018.
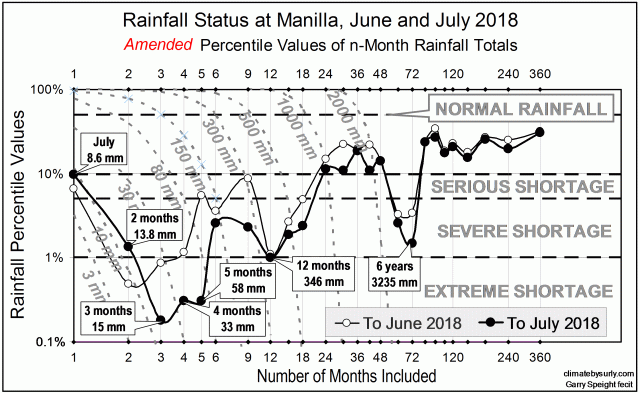
[Note 13/8/18. The large graph above is an  amended graph. Values in mm are unchanged, but percentile values have been recalculated. The 4-month and 5-month percentile values now plot as less extreme than before. The original graph is on the right.]

Graph of Rainfall Shortages

This graph shows all the present rainfall shortages at Manilla, short term and long term, in terms of percentile values. The latest values, as at the end of July, are shown by a black line with black circles. Those from one month earlier, at the end of June, are shown by a thinner line with smaller white circles.
The classes of rainfall shortage are:
• Serious shortage: below the 10th percentile;
• Severe shortage: below the 5th percentile;
• Extreme shortage: below the 1st percentile. [See note below on my usage “Extreme shortage”.]

[A graph showing shortages at the end of August is in a later post: “Drought Sixth Month; August 2018”.]

Extreme shortages

At Manilla, the drought is now extreme by several measures.
At the end of July 2018, rainfall shortages are extreme for 3 months (15 mm), 4 months (33 mm) and 5 months (58 mm). “Extreme shortage” means that Manilla has seen such shortages less than 1% of the time since 1883.
Since the end of June, rainfall totals have fallen lower for periods of 3, 4, 5, 6, and 9 months. The 5-month total fell most remarkably. It had been 121 mm, not even a “severe” shortage (below the 5th percentile), but merely a “serious” shortage (below the 10th percentile). It has now fallen to only 58 mm, which is an “extreme” shortage (below the 1st percentile). It is not much higher than the lowest ever 5-month rainfall total of 29 mm, a record set 130 years ago in 1888.

The graph makes it clear that we are now in the fifth month of an extreme drought.

Long-term shortages

At this date, there are no extreme rainfall shortages measured over periods longer than five months. However, there are some severe shortages below the fifth percentile rank. Should rainfall continue to be below average, these shortages could also become extreme. The current twelve-month total of 346 mm needs to fall only 19 mm (to 327 mm) to become an extreme shortage. The 6-year rainfall total (3234 mm) is a severe shortage lower than any since 1962. Rainfall shortages measured over periods of a year or more will not maintain groundwater levels or river flows.

[Note added July 2019.

This drought became very much worse with time. It is clearly one of the six worst droughts in history.
The rainfall status graph for June 2019 shows record-breaking low rainfall values at 15-, 18-, 24-, 30- and 72-month durations.]


Note: The term “Extreme shortage”

I have adopted classes of rainfall shortage from the classes of “Rainfall deficiency” defined by the Bureau of Meteorology in their Climate Glossary as follows:

“Serious rainfall deficiency: rainfall lies above the lowest five per cent of recorded rainfall but below the lowest ten per cent (decile range 1) for the period in question,
“Severe rainfall deficiency: rainfall is among the lowest five per cent for the period in question.
“Areas where the rainfall is lowest on record for the given time period are also shown.”

The Manilla rainfall record allows me to be more exact than the Bureau. Because the record extends back 134 years, it includes more than 1200 cumulative monthly rainfall values. I can identify percentile ranks even below the 0.1th percentile.
To the Bureau’s two classes of deficiency I add a third:

“Extreme deficiency (or extreme shortage): rainfall lies below the lowest one percent for the period in question.”