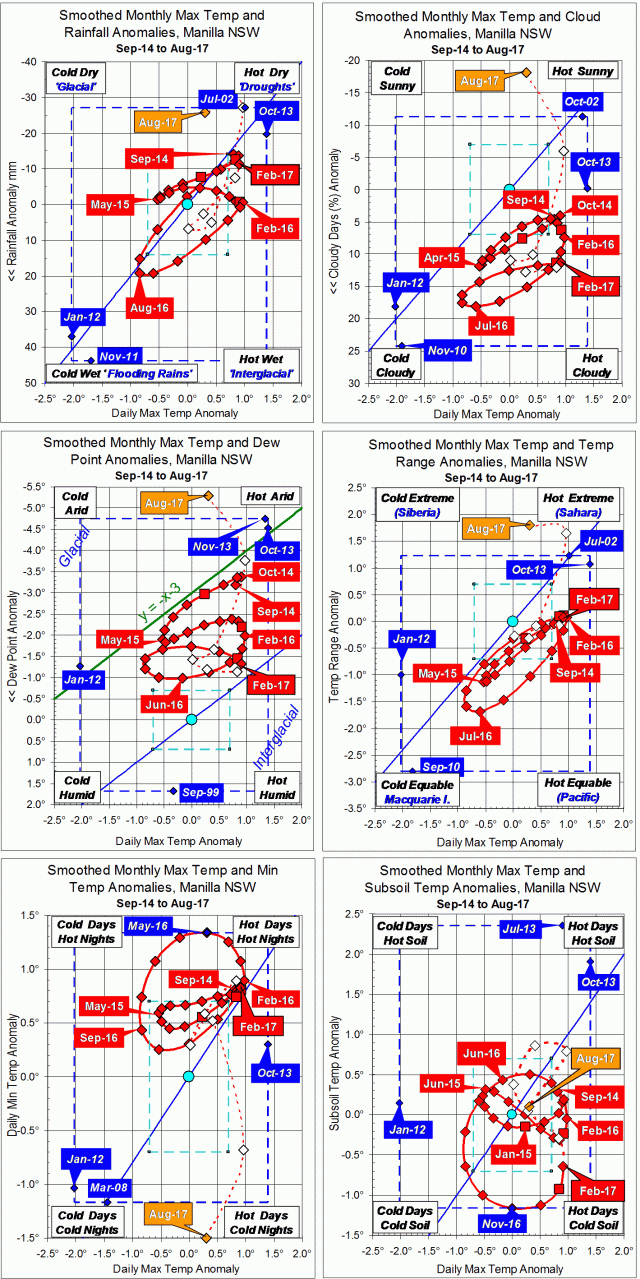
Summer record hot-dry (as smoothed)

August raw anomaly data (orange)
Temperatures
Daily maximum temperature anomaly (all x-axes): near the maximum for smoothed values.
Daily minimum temperature anomaly (lower left): near normal.
Subsoil temperature anomaly (lower right): very high.
Moistures (moist is at the bottom)
Rainfall anomaly (upper left): very low.
Cloudiness anomaly (upper right): normal.
Dew point anomaly (middle left): low, like the other recent values.
Daily temperature range anomaly (middle right): very high.
Latest fully smoothed data (red), summer 2018-19
Temperatures
Daily maximum temperature anomaly peaked at a record +1.79° in January.
Daily minimum temperature anomaly held the record vaue of +2.16° through January and February.
Subsoil rose rapidly from normal.
Moistures (moist is at the bottom)
Rainfall smoothed anomaly peaked negative in January at the record value of minus 31.75 mm per month.
Cloudiness was normal.
Dew point was low.
Daily temperature range was normal.
Notes:
January data points are marked by squares.
Smoothing Continue reading