21stC Rain Shortage August 2020

Manilla extreme and severerainfall shortages from onset to breaking January 200 to August 2020.

New data for monthly rainfall totals at Manilla up to August 2020 show an altered pattern since October 2019 in this worst-ever drought.

[For explanation of this graph, see below: “About drought duration graphs”.]

Shortages January 2000 to August 2020

At Manilla, acute seasonal droughts ceased in 2019

Two periods of extreme rainfall shortage had extended through the mid-winters of 2018 and 2019. These were acute shortages of seasonal to annual duration. However, by the end of 2019 these very short-term rainfall shortages had ended: they were no longer extreme shortages in the 1st percentile. Although they were not even serious shortages, the fact that monthly rainfalls were below average prevented district water storage levels from rising.
As the 15-month, 18-month, and 24-month shortages persisted beyond January they ceased being extreme (1st percentile), but became merely severe (5th percentile). By that time, these two to three-year rainfall shortages had lasted longer as extreme (1st percentile) shortages than ever before (such as in 1965 or 1912).

Continuing extreme rainfall shortages

Extreme rainfall shortages linked to the 2018-19 drought at Manilla are now concentrated in the mid-range of duration – about 3-years to 10-years.
From 30-month duration up to 240-months duration, nearly all the selected durations are coloured red for extreme rainfall shortage, persisting up to the current month (August 2020). In this super-drought, extreme shortages of longer duration consistently had onset earlier than those of shorter duration: the longest, that of 240-month duration, started before 2000. (At Manilla, historic droughts differ in their pattern of date of onset versus date of drought-breaking.)
Not all very long-duration shortages are currently extreme.
At 108-month duration, the severity ceased to be extreme in March 2020. Neither the 120-month duration nor the 150-month duration reached beyond a severe shortage at any time. At the longest duration on the chart (360-months), not even a serious shortage has yet appeared.

Complete Manilla drought record to Oct 2019

Compete record to October 2019

For context, I have re-posted the graph for the whole historic record to October 2019.


About drought duration graphs

These graphs show the onset, persistence, and breaking of episodes of extreme and severe rainfall shortage (droughts) at Manilla. The Continue reading

August 2020: still gripped by extreme drought

Rainfall status Manilla drought to August 2020

Little rain fell in twelve months

In the past 12 months, only February (165 mm) and March (53 mm) had adequate rain at Manilla. Rain was so scarce that the 12-month total was just under 500 mm, far below the average of 652 mm. So the drought situation has not improved lately.

Seasonal to annual shortages were not serious

Through the year, most rainfall totals for 12-months or less have been below the average, but not serious shortages. The acute phase of the drought was over by February, if not much earlier.

Two-year to eight-year shortages were extreme

This worst-ever drought for Manilla has been marked by extreme (often record-breaking) rainfall shortages with durations from two years to eight years. They persist in the data for August 2020 shown in this graph.

Twenty-year and thirty-year shortages

The shortages with the longest duration included here had been near the 70th percentile in 2012, but are now very much worse. The twenty-year (240-month) shortage is now in the 1st percentile.

How to read the graph

This graph shows all the present rainfall shortages at Manilla, short term and long term, as percentile values. The latest values are shown by a thick black line with large circles. Those from one month earlier are shown by a thinner line with small diamonds. [The method is described in “Further Explanation” below.]


Further Explanation

The following notes explain aspects of this work under these listed headings:

Data analysis

Cumulative rainfall totals
Percentile values
Severity of rainfall shortages

Limitations of this analysis

Monthly rainfalls form a single population
Observations are not retrospective
The rain gauge failed

Data analysis

Continue reading

July 2020: extreme drought lingers

Rain status at Manilla NSW June and July 2020

The lingering long-term drought

As shown, Manilla is still in extreme drought: the rainfall totals from 30-months to 96-months are in the lowest 1% in history. Not only that, but the 42-month total to July (1440 mm) and the 96-month total (4056 mm) are the lowest ever recorded.

Acute drought in 2018 and 2019

This worst-ever drought at Manilla had a false start in September 2017, with severe 2-month and 3-month shortages (below the 5th percentile), but began in earnest in winter (JJA) 2018, with many extreme shortages (below the 1st percentile) that were shorter than one year duration. Such seasonal extreme shortages came again in spring (SON) 2019.
These acute shortages were ended by the rain of February 2020, but extreme and record-breaking shortages with duration of two or more years have persisted up to now.

How to read the graph

This graph shows all the present rainfall shortages at Manilla, short term and long term, as percentile values. The latest values are shown by a thick black line with large circles. Those from one month earlier are shown by a thinner line with small diamonds. [The method is described in “Further Explanation” below.]


Further Explanation

The following notes explain aspects of this work under these listed headings:

Data analysis

Cumulative rainfall totals
Percentile values
Severity of rainfall shortages

Limitations of this analysis

Monthly rainfalls form a single population
Observations are not retrospective
The rain gauge failed

Data analysis

Continue reading

June 2020: return to a 42-month drought record

Rain status at June 2020 at Manilla NSW

Changing shortages

Rainfall of 20.8 mm in June 2020 was far below the average (44 mm), reaching only to the 28th percentile.
Although this low rainfall did not cause any rainfall total for 12-months or less to become a serious shortage, all totals for longer durations were serious shortages or worse. Two were serious (<10th %-ile), six were severe (<5th %-ile), and nine were extreme (<1st %-ile). Nearly all of them had become drier than in May.
The 42-month total, which had set a driest record of 1468 mm in April, now beat this with 1457 mm in June. At two other durations, rainfall totals were 2nd-driest: at 84-months, 3471 mm; and at 96-months, 4142 mm.

How to read the graph

This graph shows all the present rainfall shortages at Manilla, short term and long term, as percentile values. The latest values are shown by a thick black line with large circles. Those from one month earlier are shown by a thinner line with small diamonds. [The method is described in “Further Explanation” below.]


Further Explanation

The following notes explain aspects of this work under these listed headings:

Data analysis

Cumulative rainfall totals
Percentile values
Severity of rainfall shortages

Limitations of this analysis

Monthly rainfalls form a single population
Observations are not retrospective
The rain gauge failed

Data analysis

Continue reading

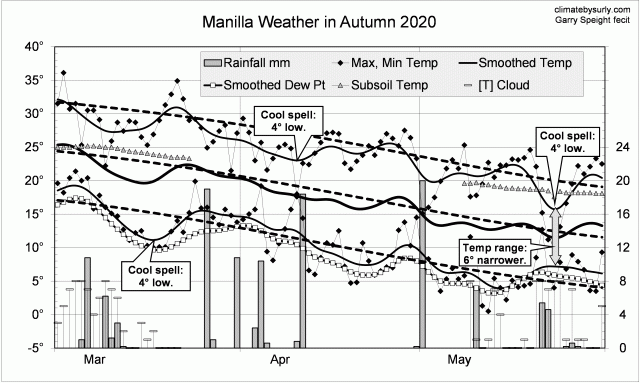
A cool moist autumn in 2020

The daily weather log

[Note.
Due to illness, 45 days of this season, from 23rd March to 7th May, were missed for some Manilla values. No values were noted for cloud or soil temperature; mean values shown for the season are estimates only. Missed values of daily maximum and minimum air temperatures were estimated by regression on values from Tamworth Airport Automatic Weather Service.]

Instead of warm spells as in autumn 2019, this season had several cool spells. Three or four had cool days, but one in mid-march had cooler nights. Cool days in late May came with a very narrow daily temperature range, high humidity and cloud.
There were 18 rain days (normally 14) spread through the season, with the highest reading (20.0 mm) on the 1st of May.

Weather log autumn 2020

Comparing autumn seasons

In contrast to the previous two autumn seasons, autumn 2020 was cool and moist. Days (24.4 deg) were 2nd coolest for autumn in the new century (after 2003). Night temperatures were normal, and the mean one degree low.
The rainfall total, 124 mm, was at the 55th percentile, not far below the mean of 134 mm. Other moisture measures were higher: early morning dew point was 9.0 deg, cloudiness 41%, and daily temperature range 13.8 deg.

Climate for autumn 2020


Data. The Bureau of Meteorology automatic rain gauge, Manilla Museum, Station 55312, recorded no readings from 24th February 2020 until 11th March 2020. I used my own readings for that period. Readings later in autumn are from the Manilla (Museum) gauge.

My estimates of early morning dew point have become anomalously low. From 1 August 2019, I use values taken from Tamworth Airport graphs at the time of minimum temperature.
All other data, including subsoil at 750 mm, are from 3 Monash Street, Manilla.