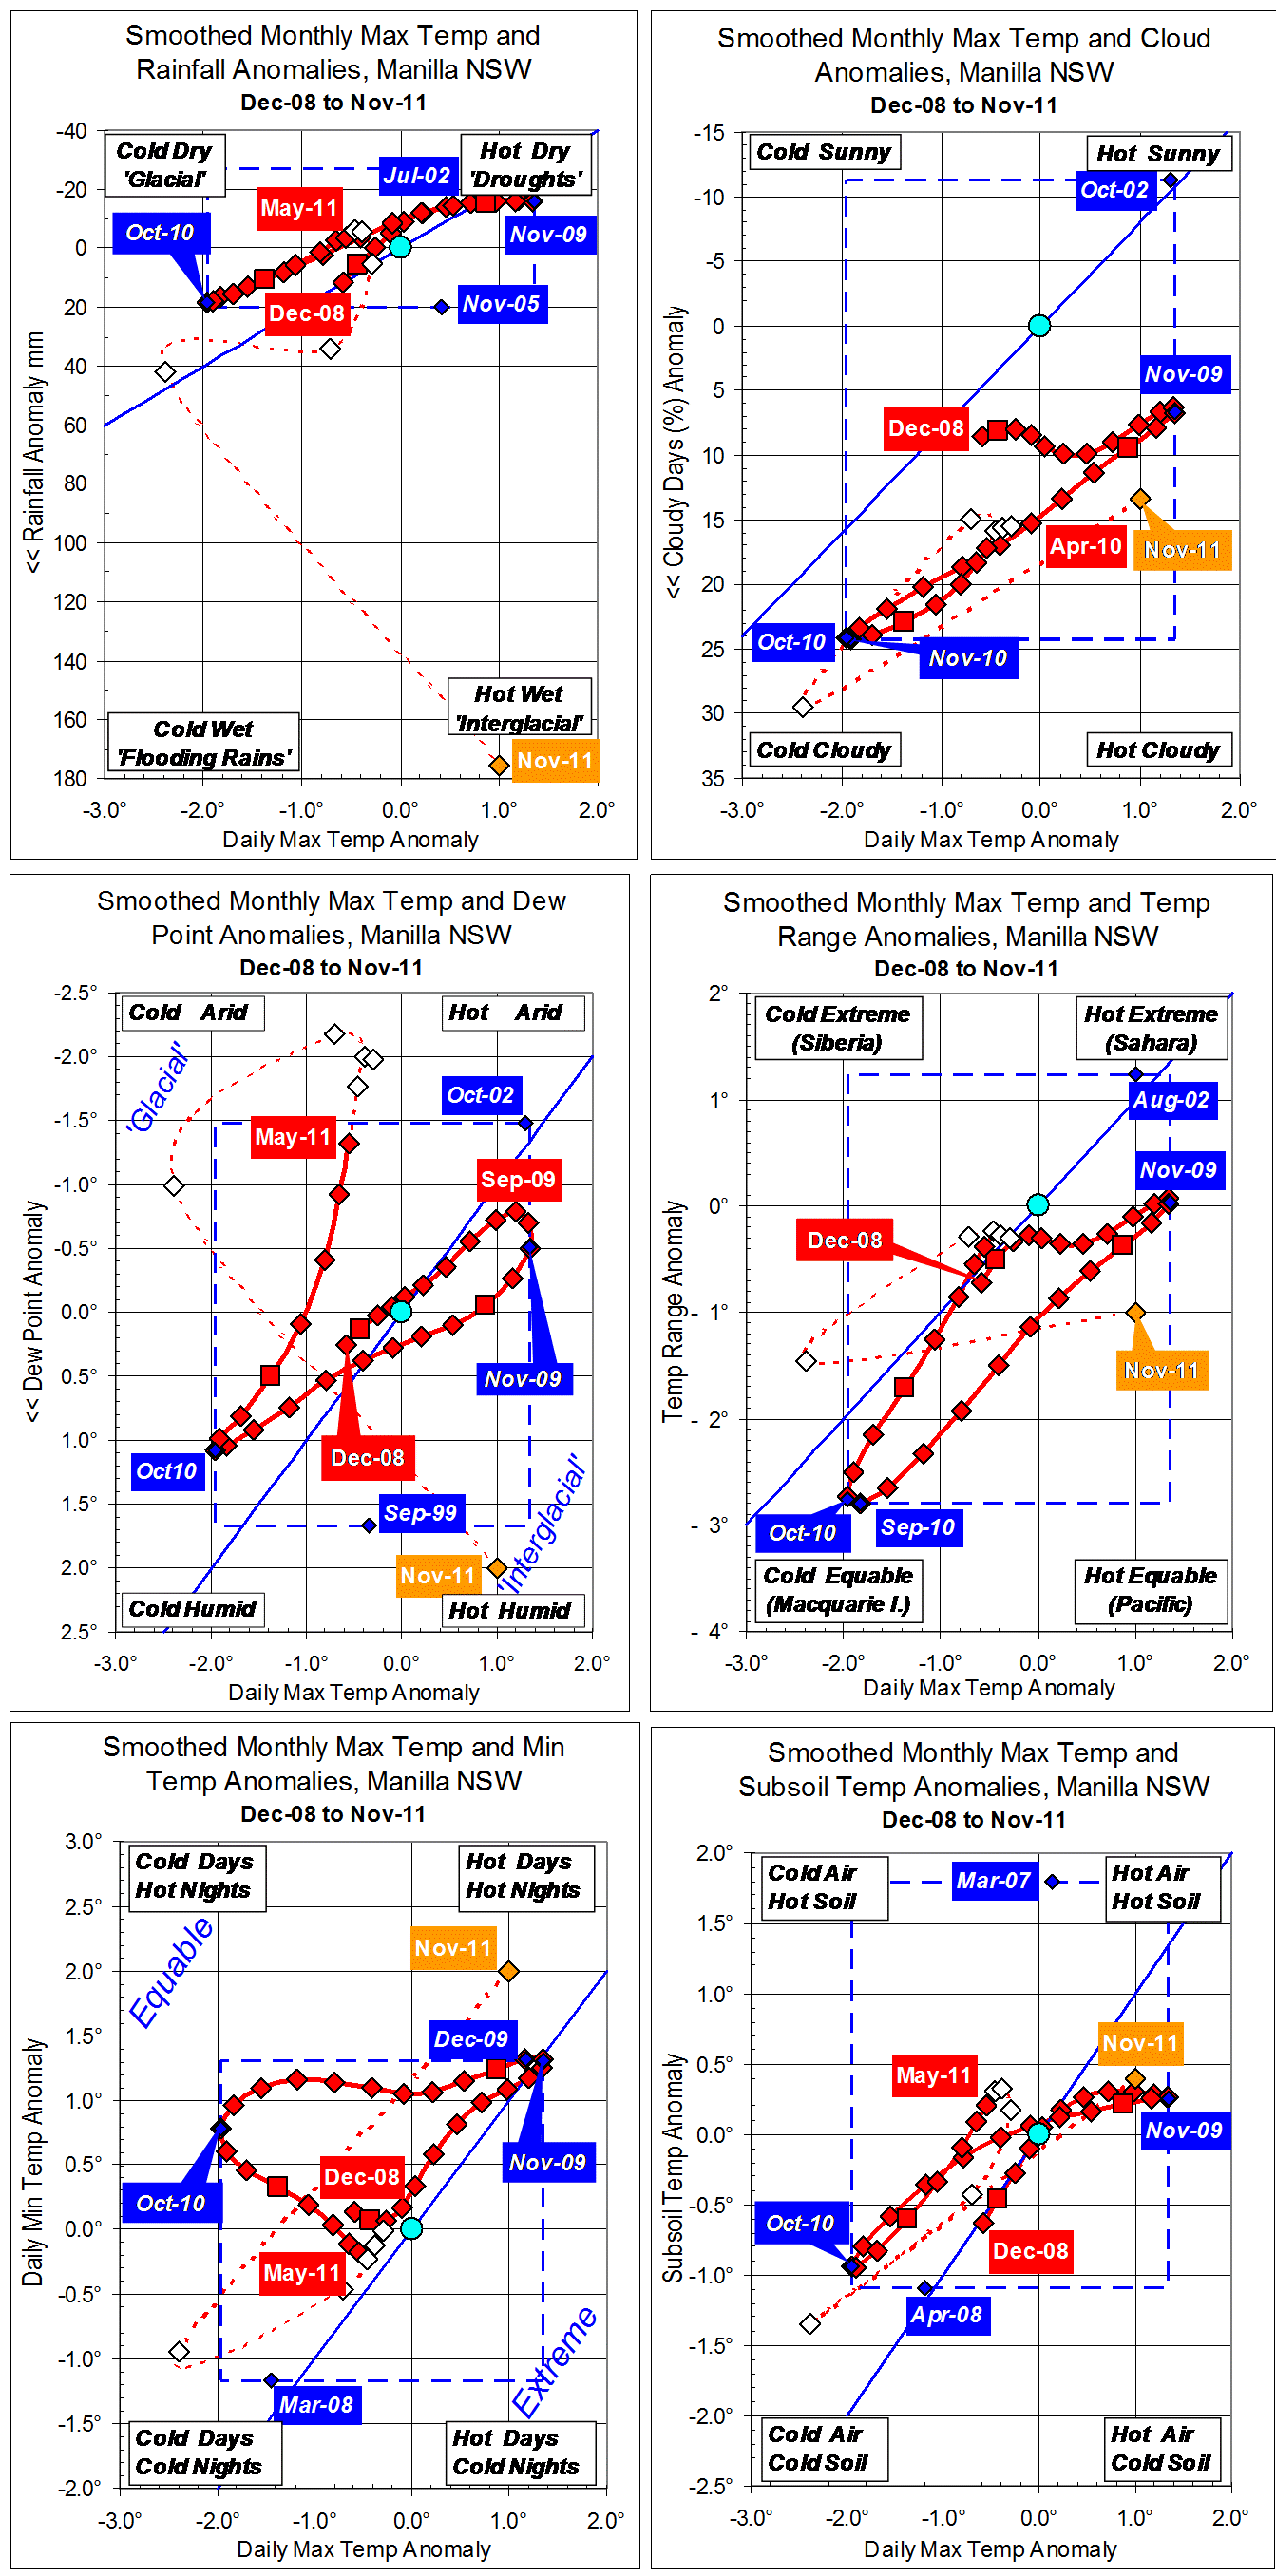
Parametric plots of smoothed climate variables at Manilla
“Extreme changes”
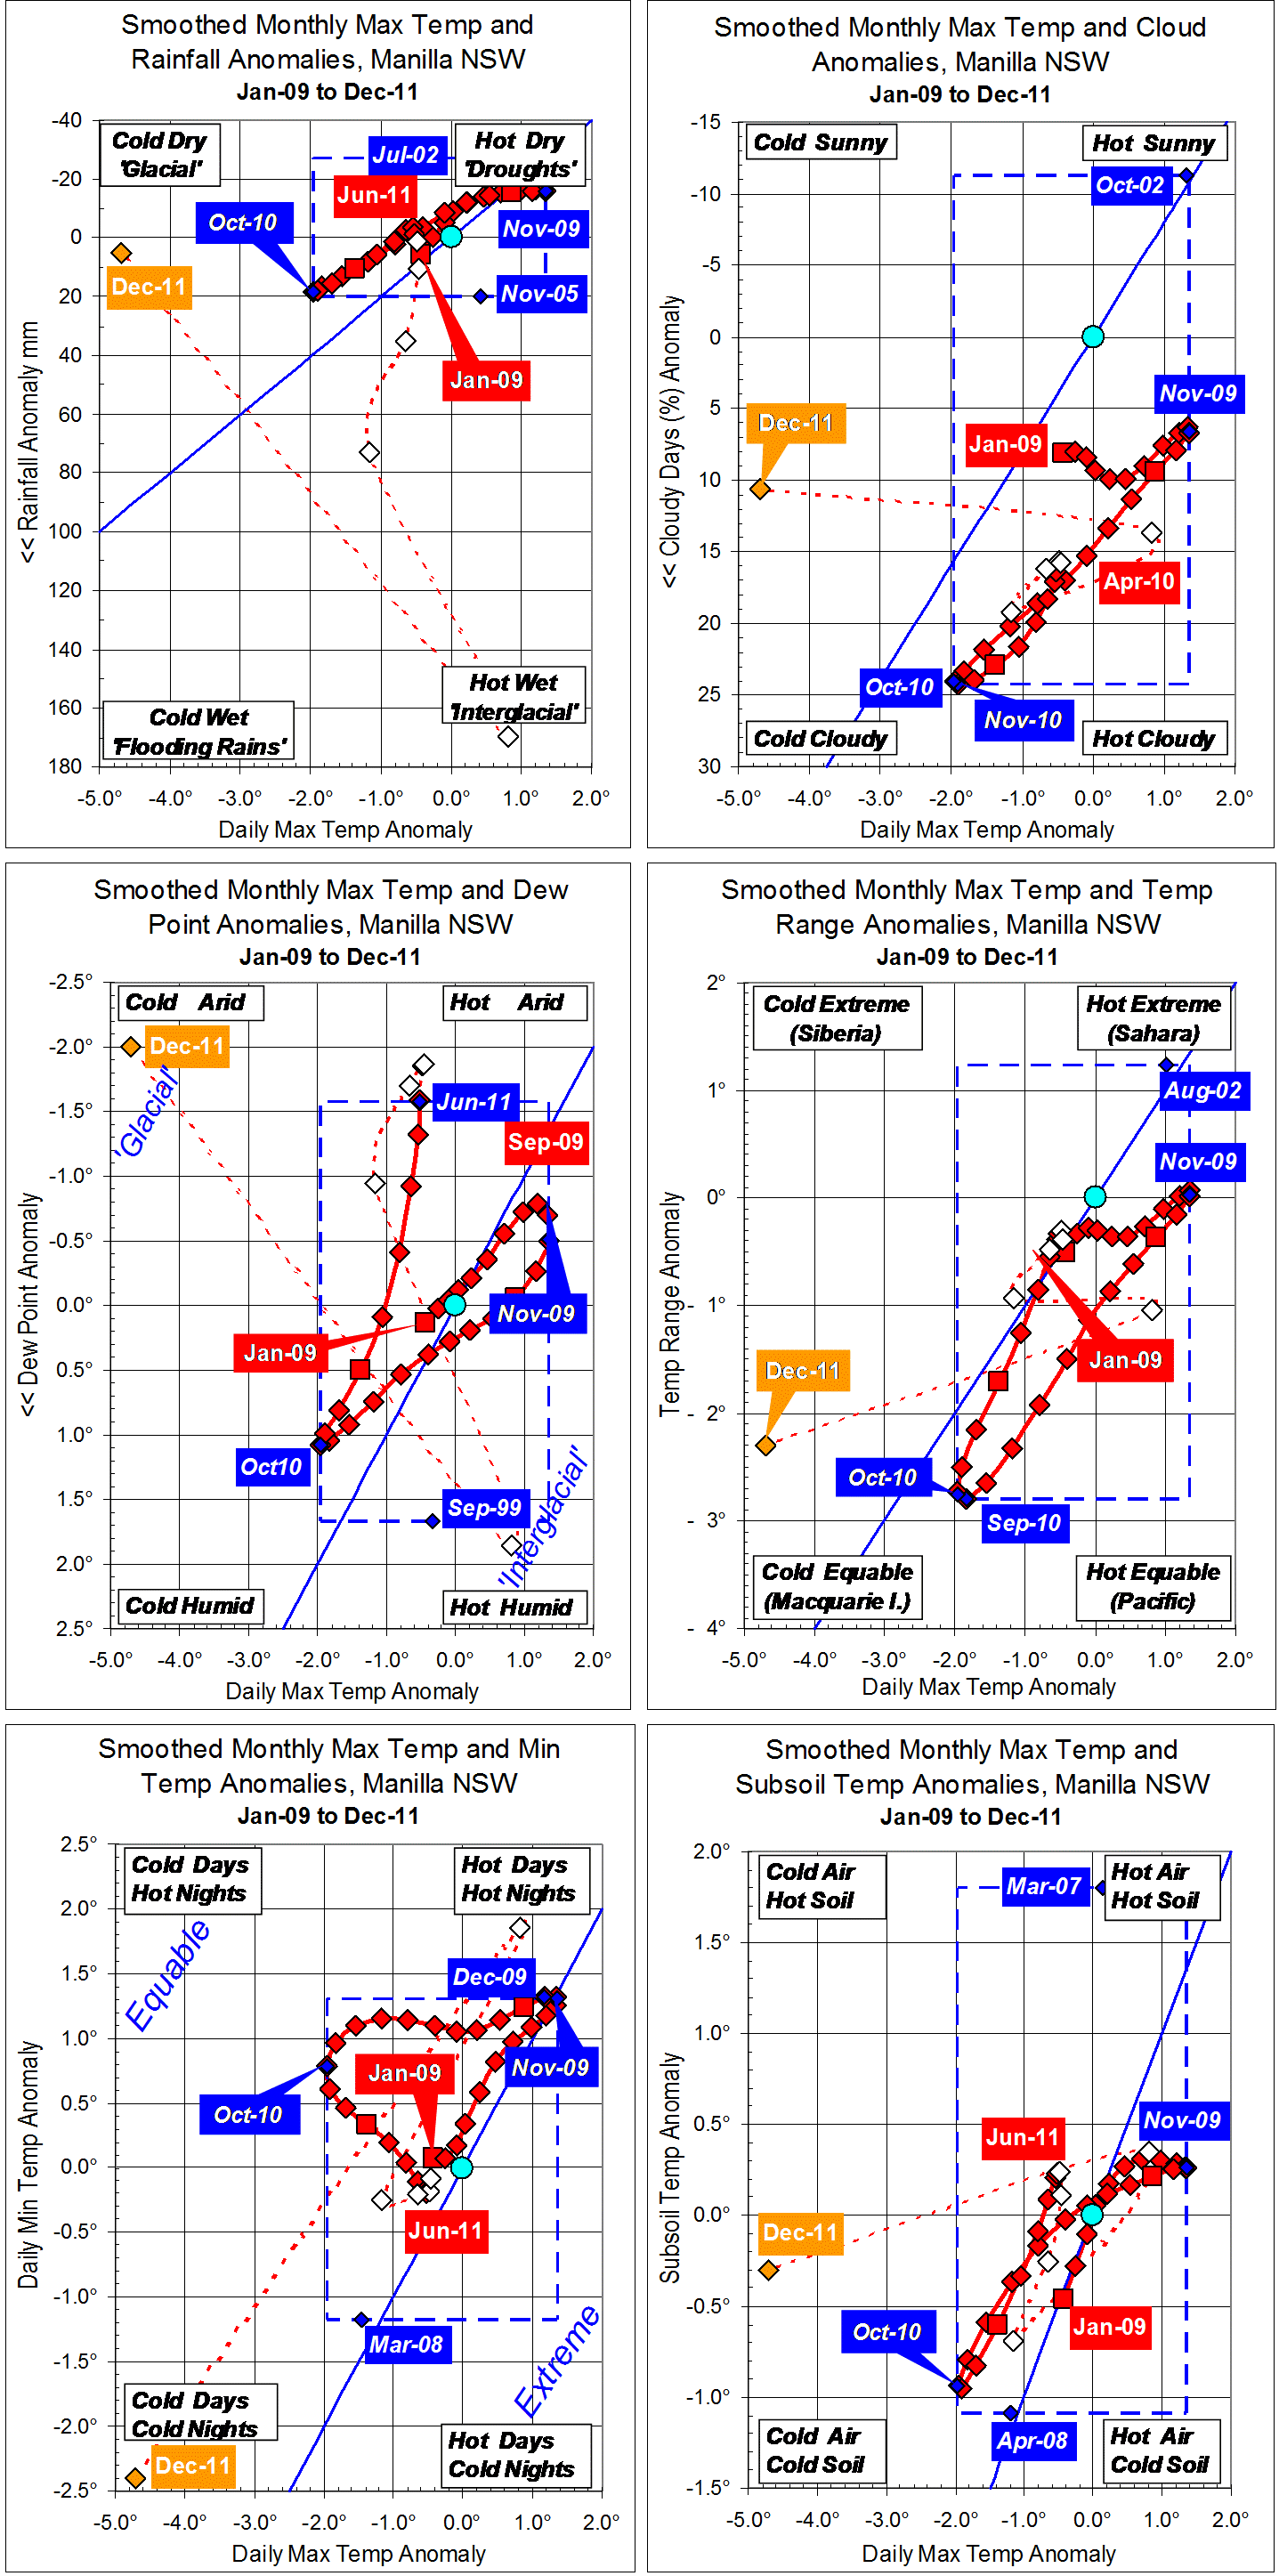
Raw values for some anomalies leap from one extreme to another from November to December 2011. Daily maximum temperature (X-axis, all graphs), from a very high value in November, went to such a remarkably low value (-4.7°) that the scale had to be extended by two degrees.
On the top left graph, the rainfall anomaly returned from an extreme positive value to near zero. Taking max temp and rainfall together, November values were part-way towards the climate of an interglacial epoch, while December values were part-way towards that of a glacial epoch. The centre left graph, including Dew Point anomaly, shows the same effect: hot humid (interglacial) jumping to cold arid (glacial).
While daily temperature range (centre right graph) changed little, daily minimum temperature (bottom left graph) moved with maximum temperature from an extreme of hot days and hot nights to a greater extreme of cold days and cold nights. The November and December values mentioned are far beyond the normal limits (dashed blue lines) set by smoothed data points since 1999.
The last fully-smoothed value (June 2011, in red) for Dew Point anomaly requires the blue line to be moved. It sets a new lower limit for smoothed Dew Point anomaly: -1.58°. Next month may see the July 2011 value set a new record.
Except for humid November 2011, Dew Points at Manilla have now shown remarkable aridity for eight months.
Note: Fully smoothed data – Gaussian smoothing with half-width 6 months – are plotted in red, partly smoothed data uncoloured, and raw data for the last data point in orange. January data points are marked by squares. Blue diamonds and the dashed blue rectangle show the extreme values in the fully smoothed data record since September 1999.

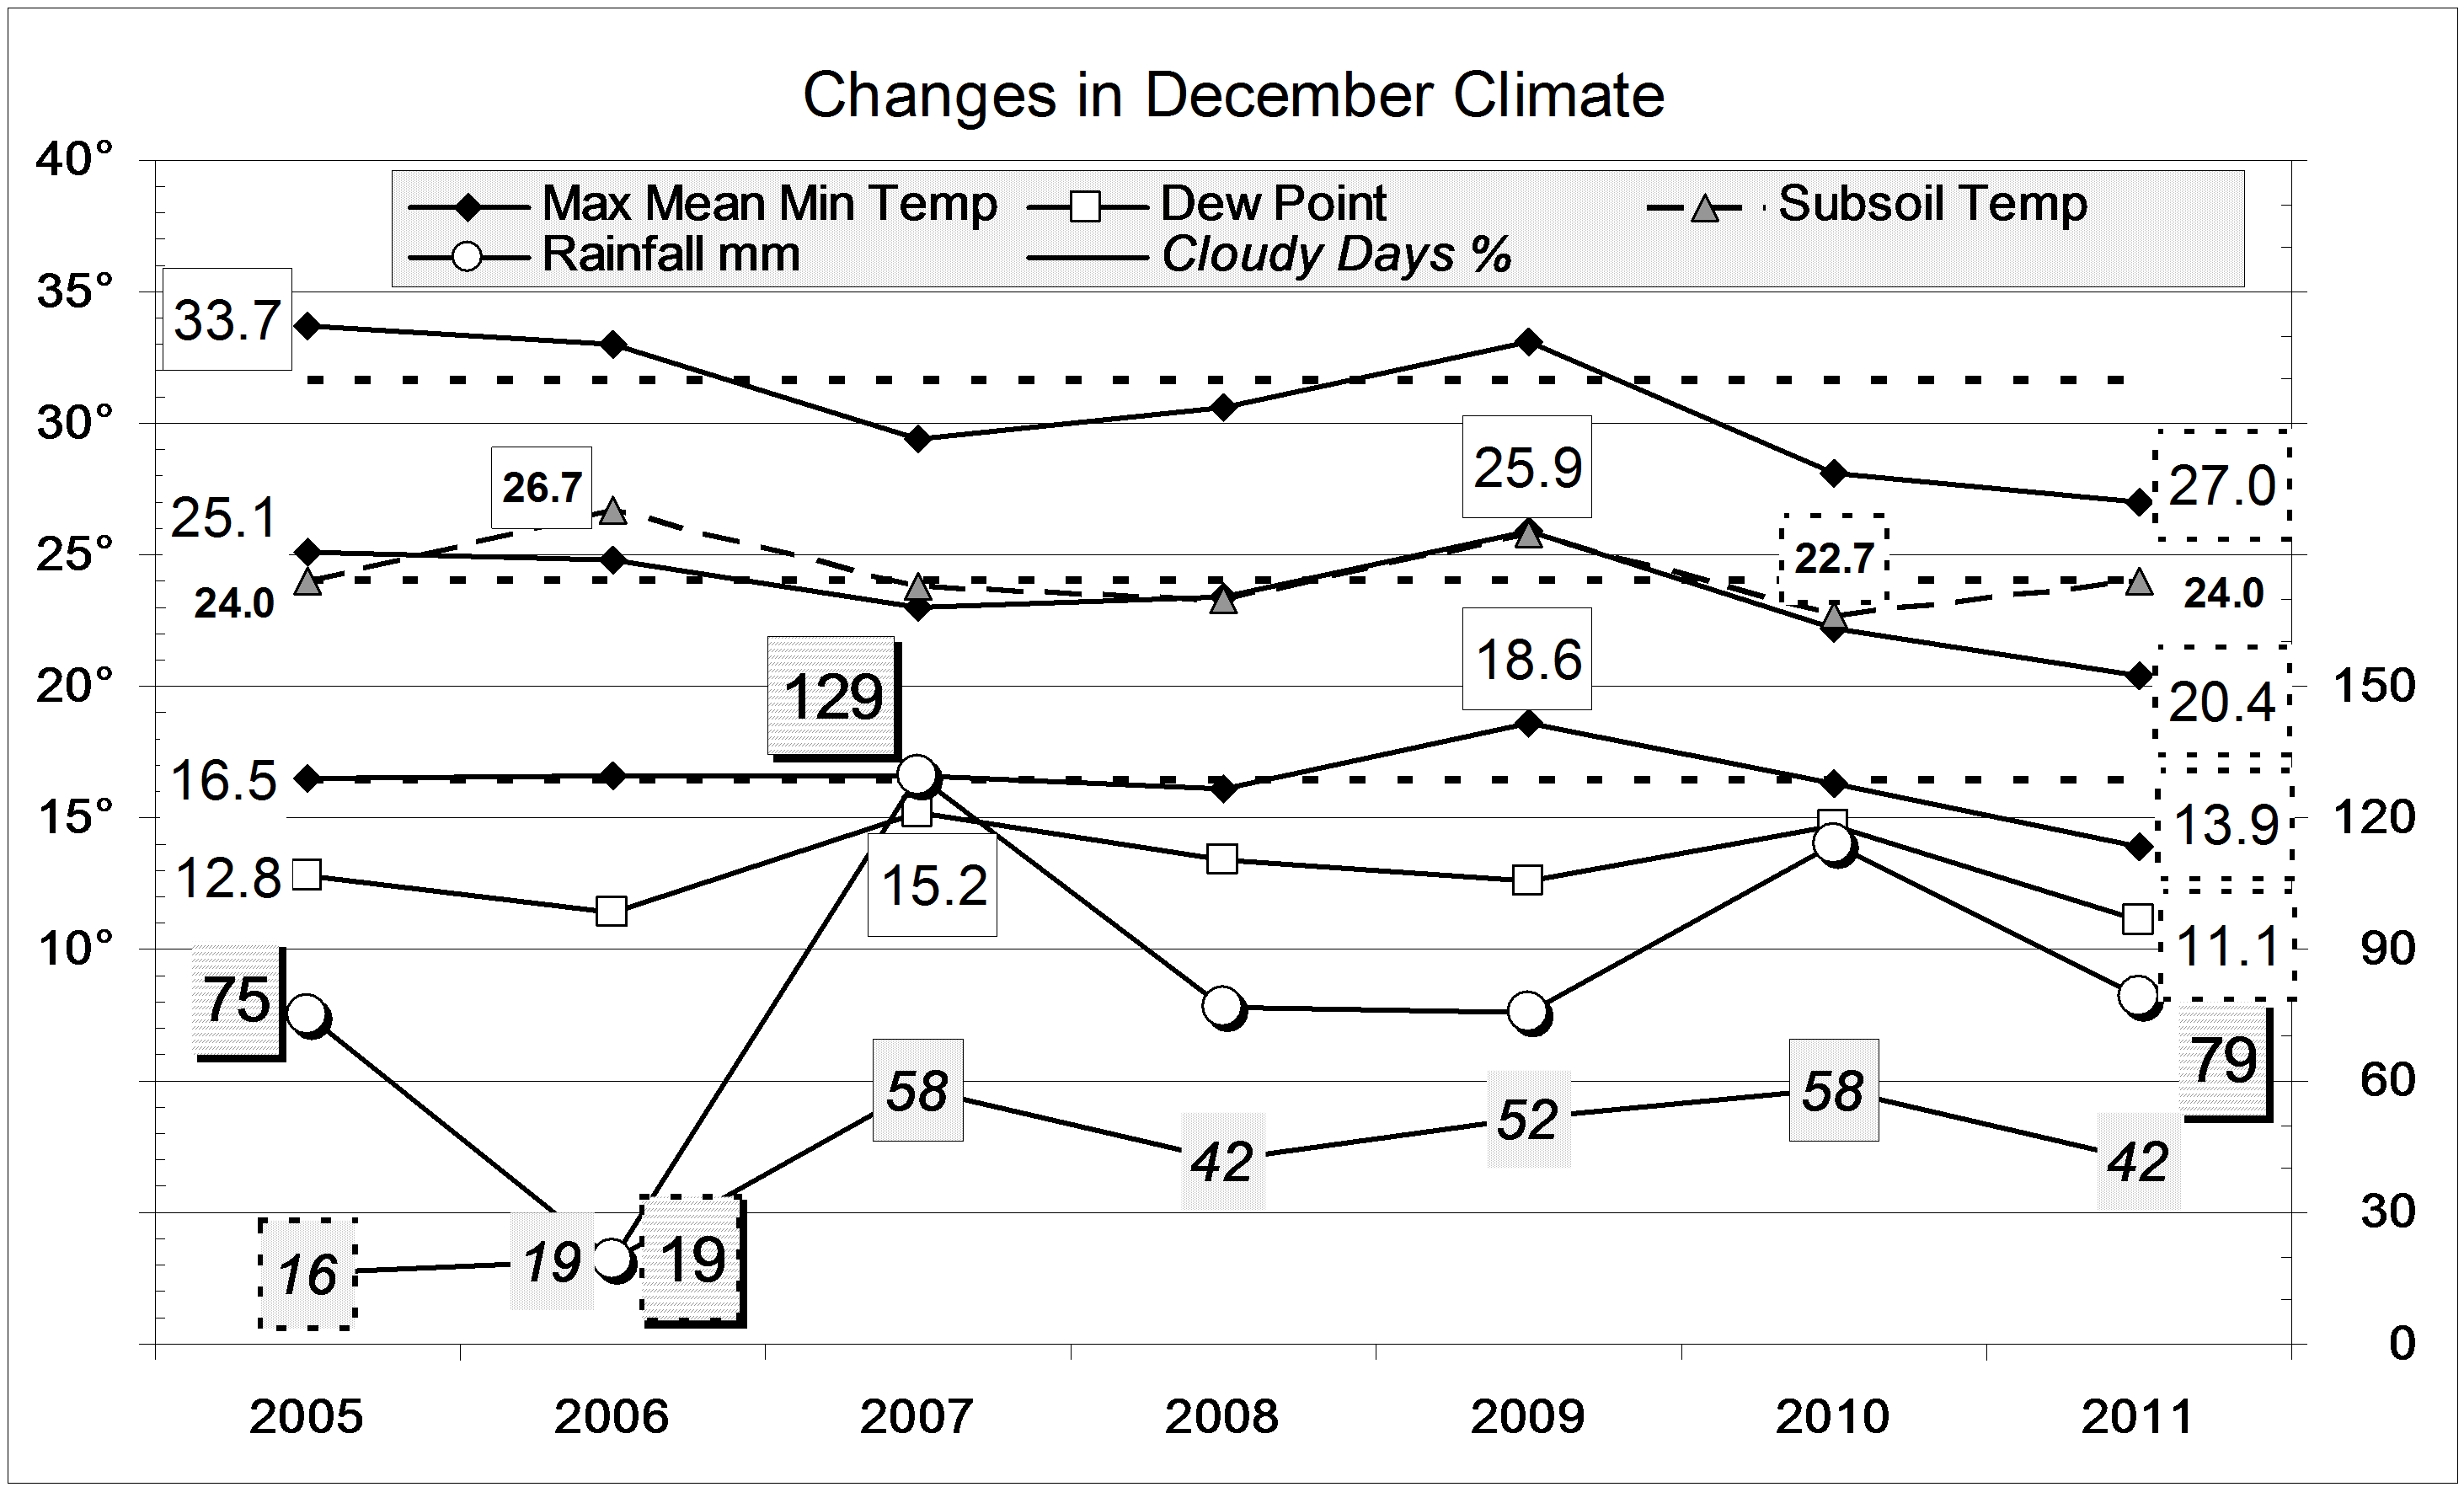
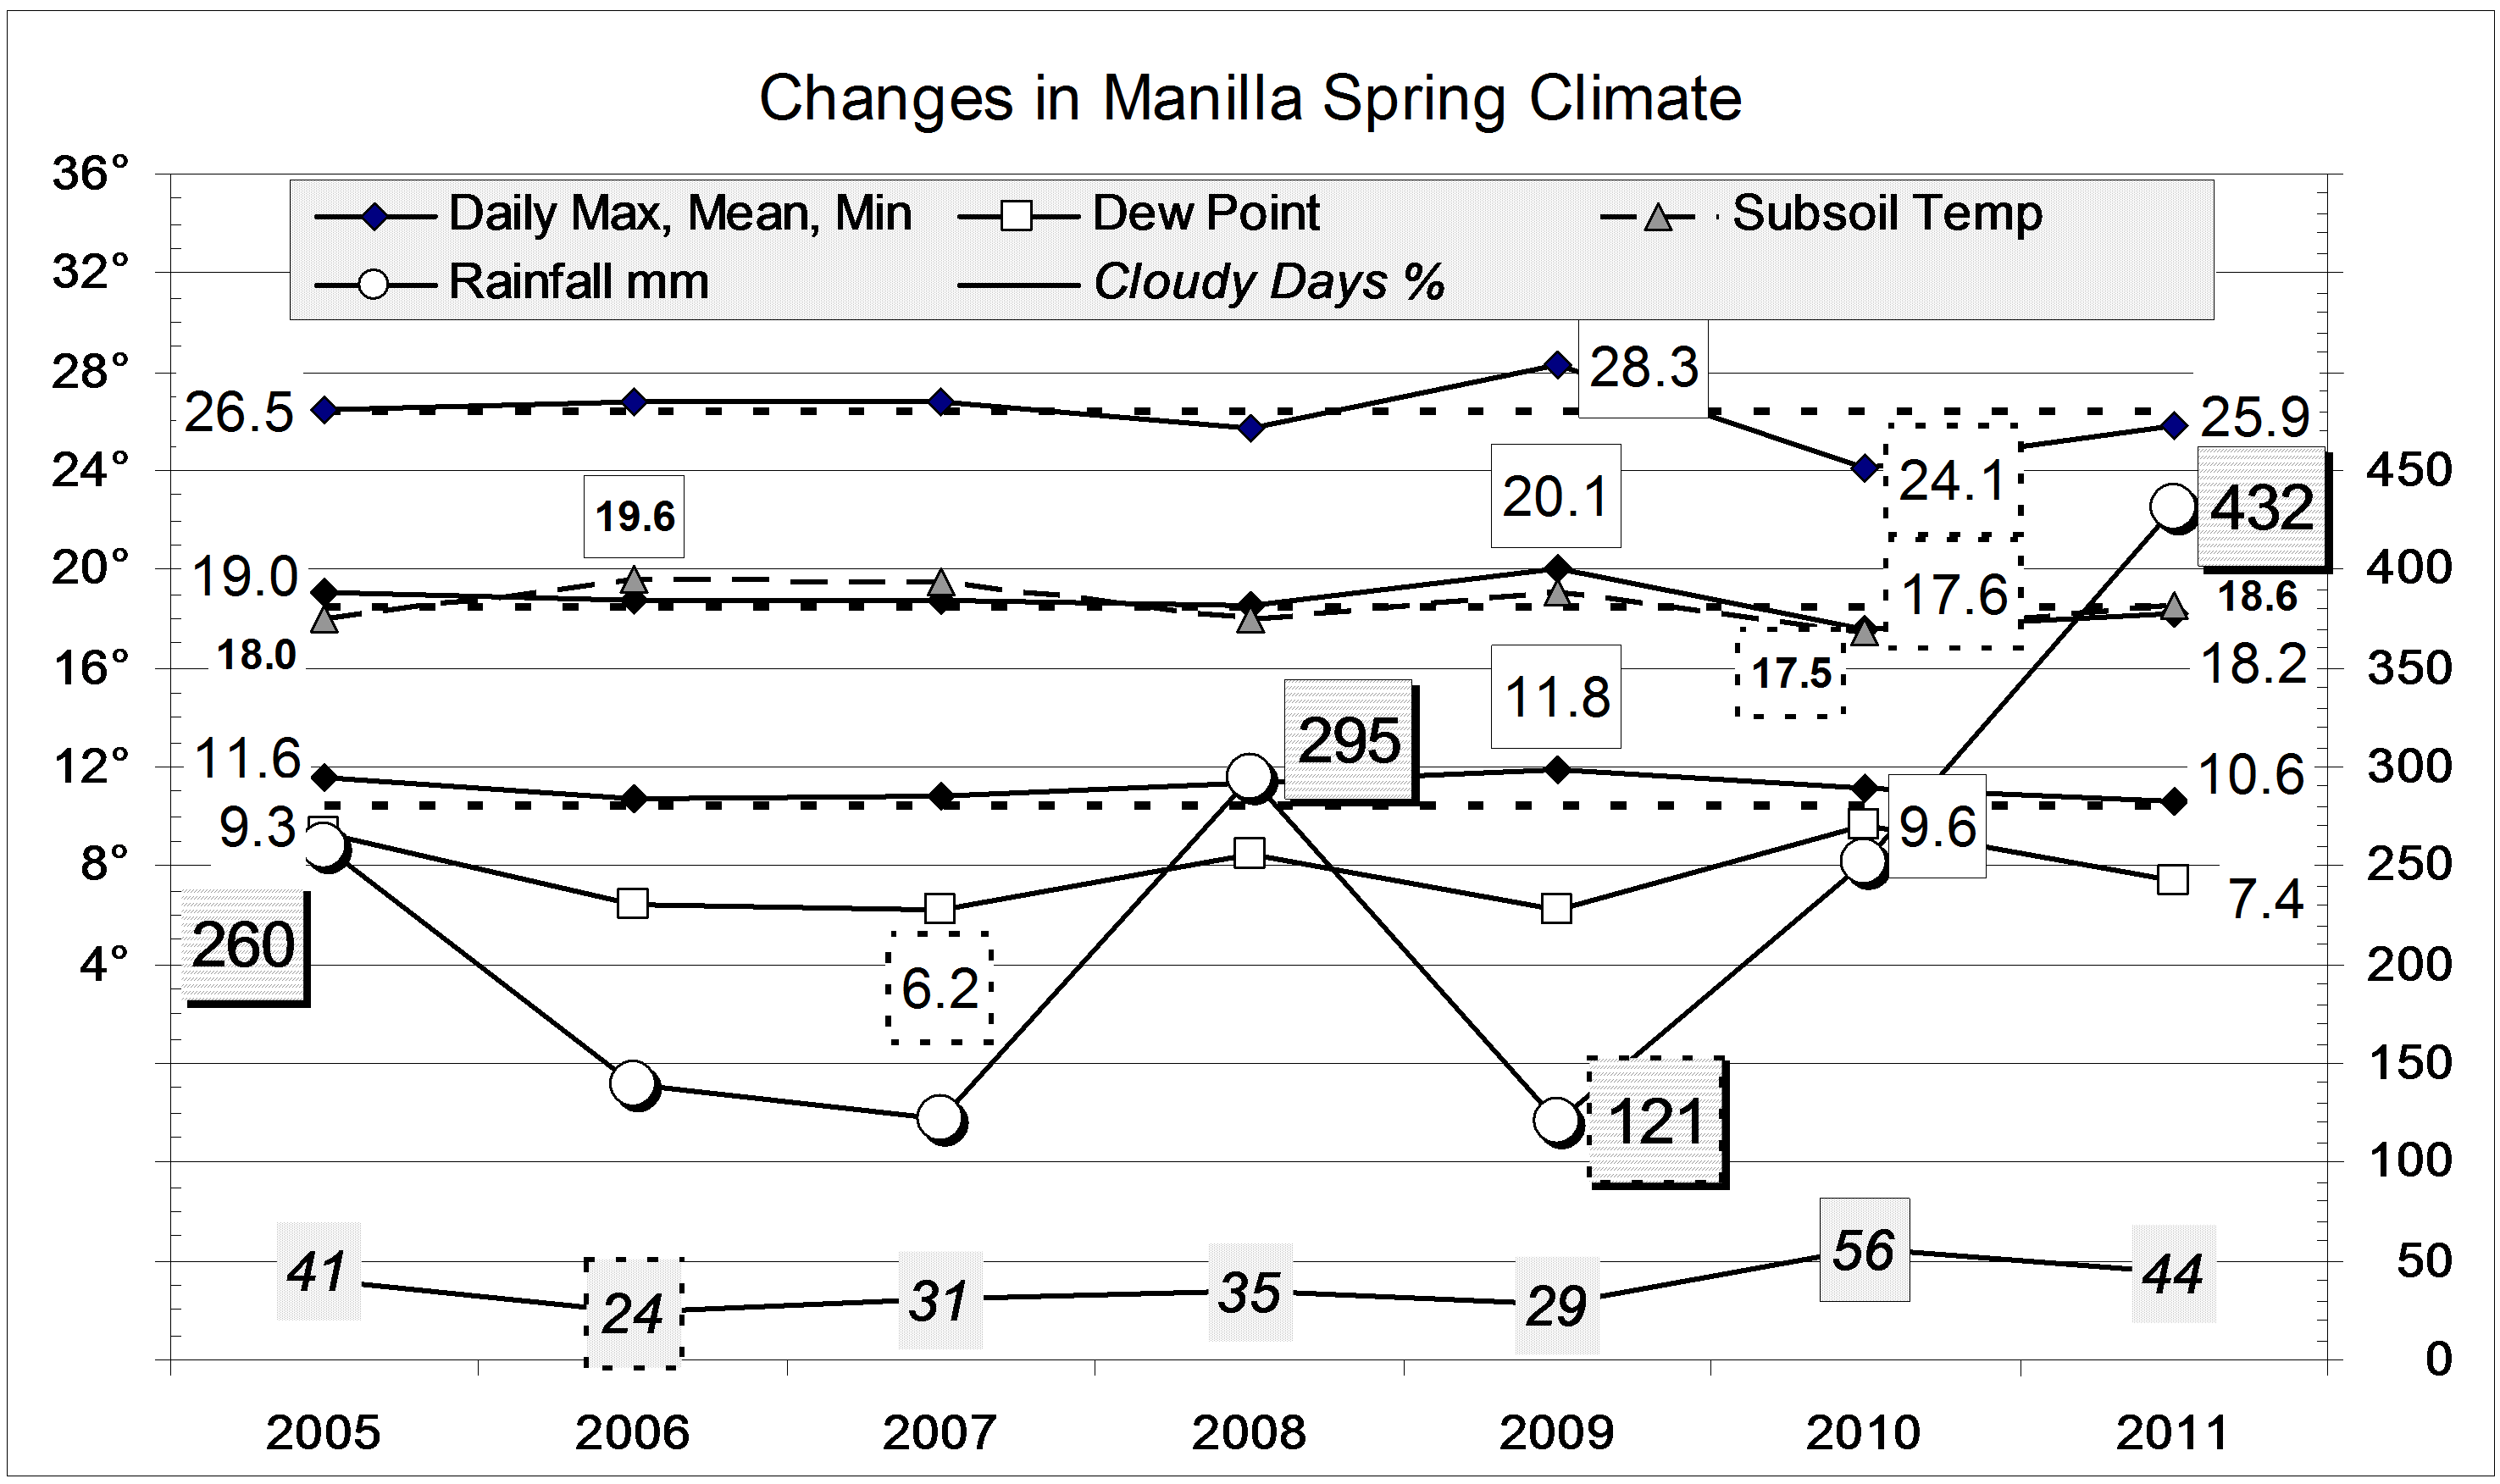
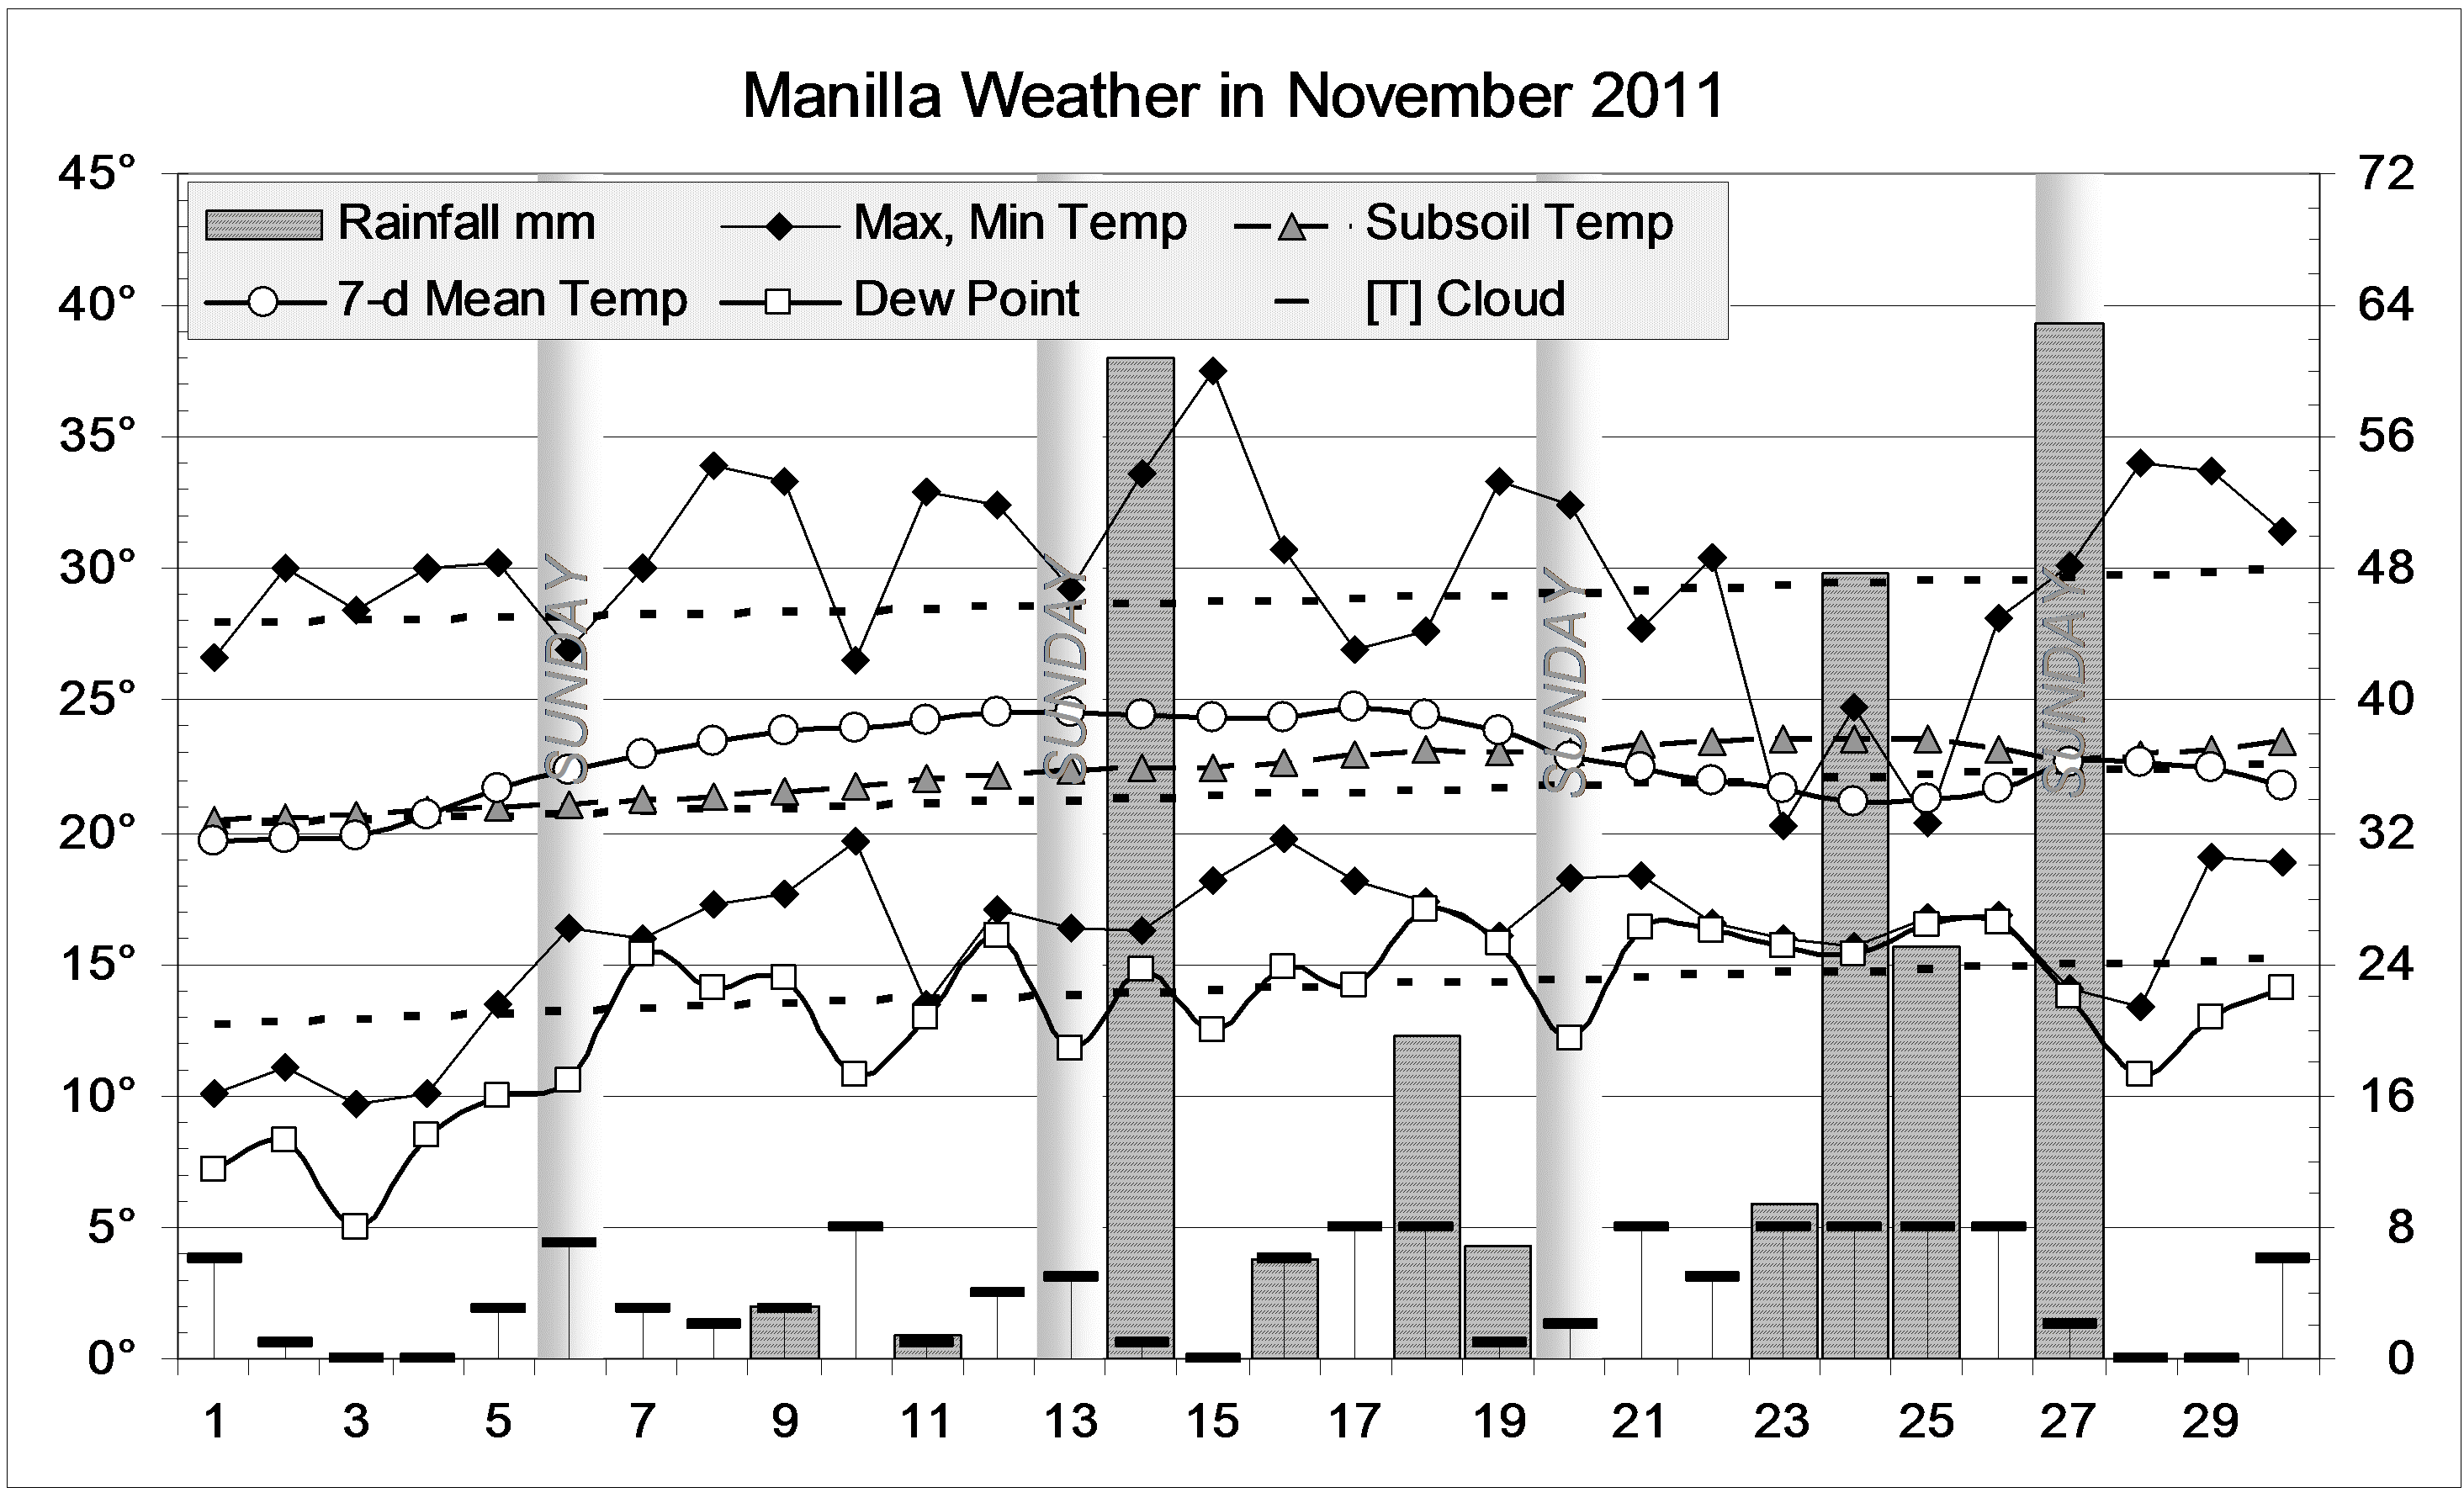
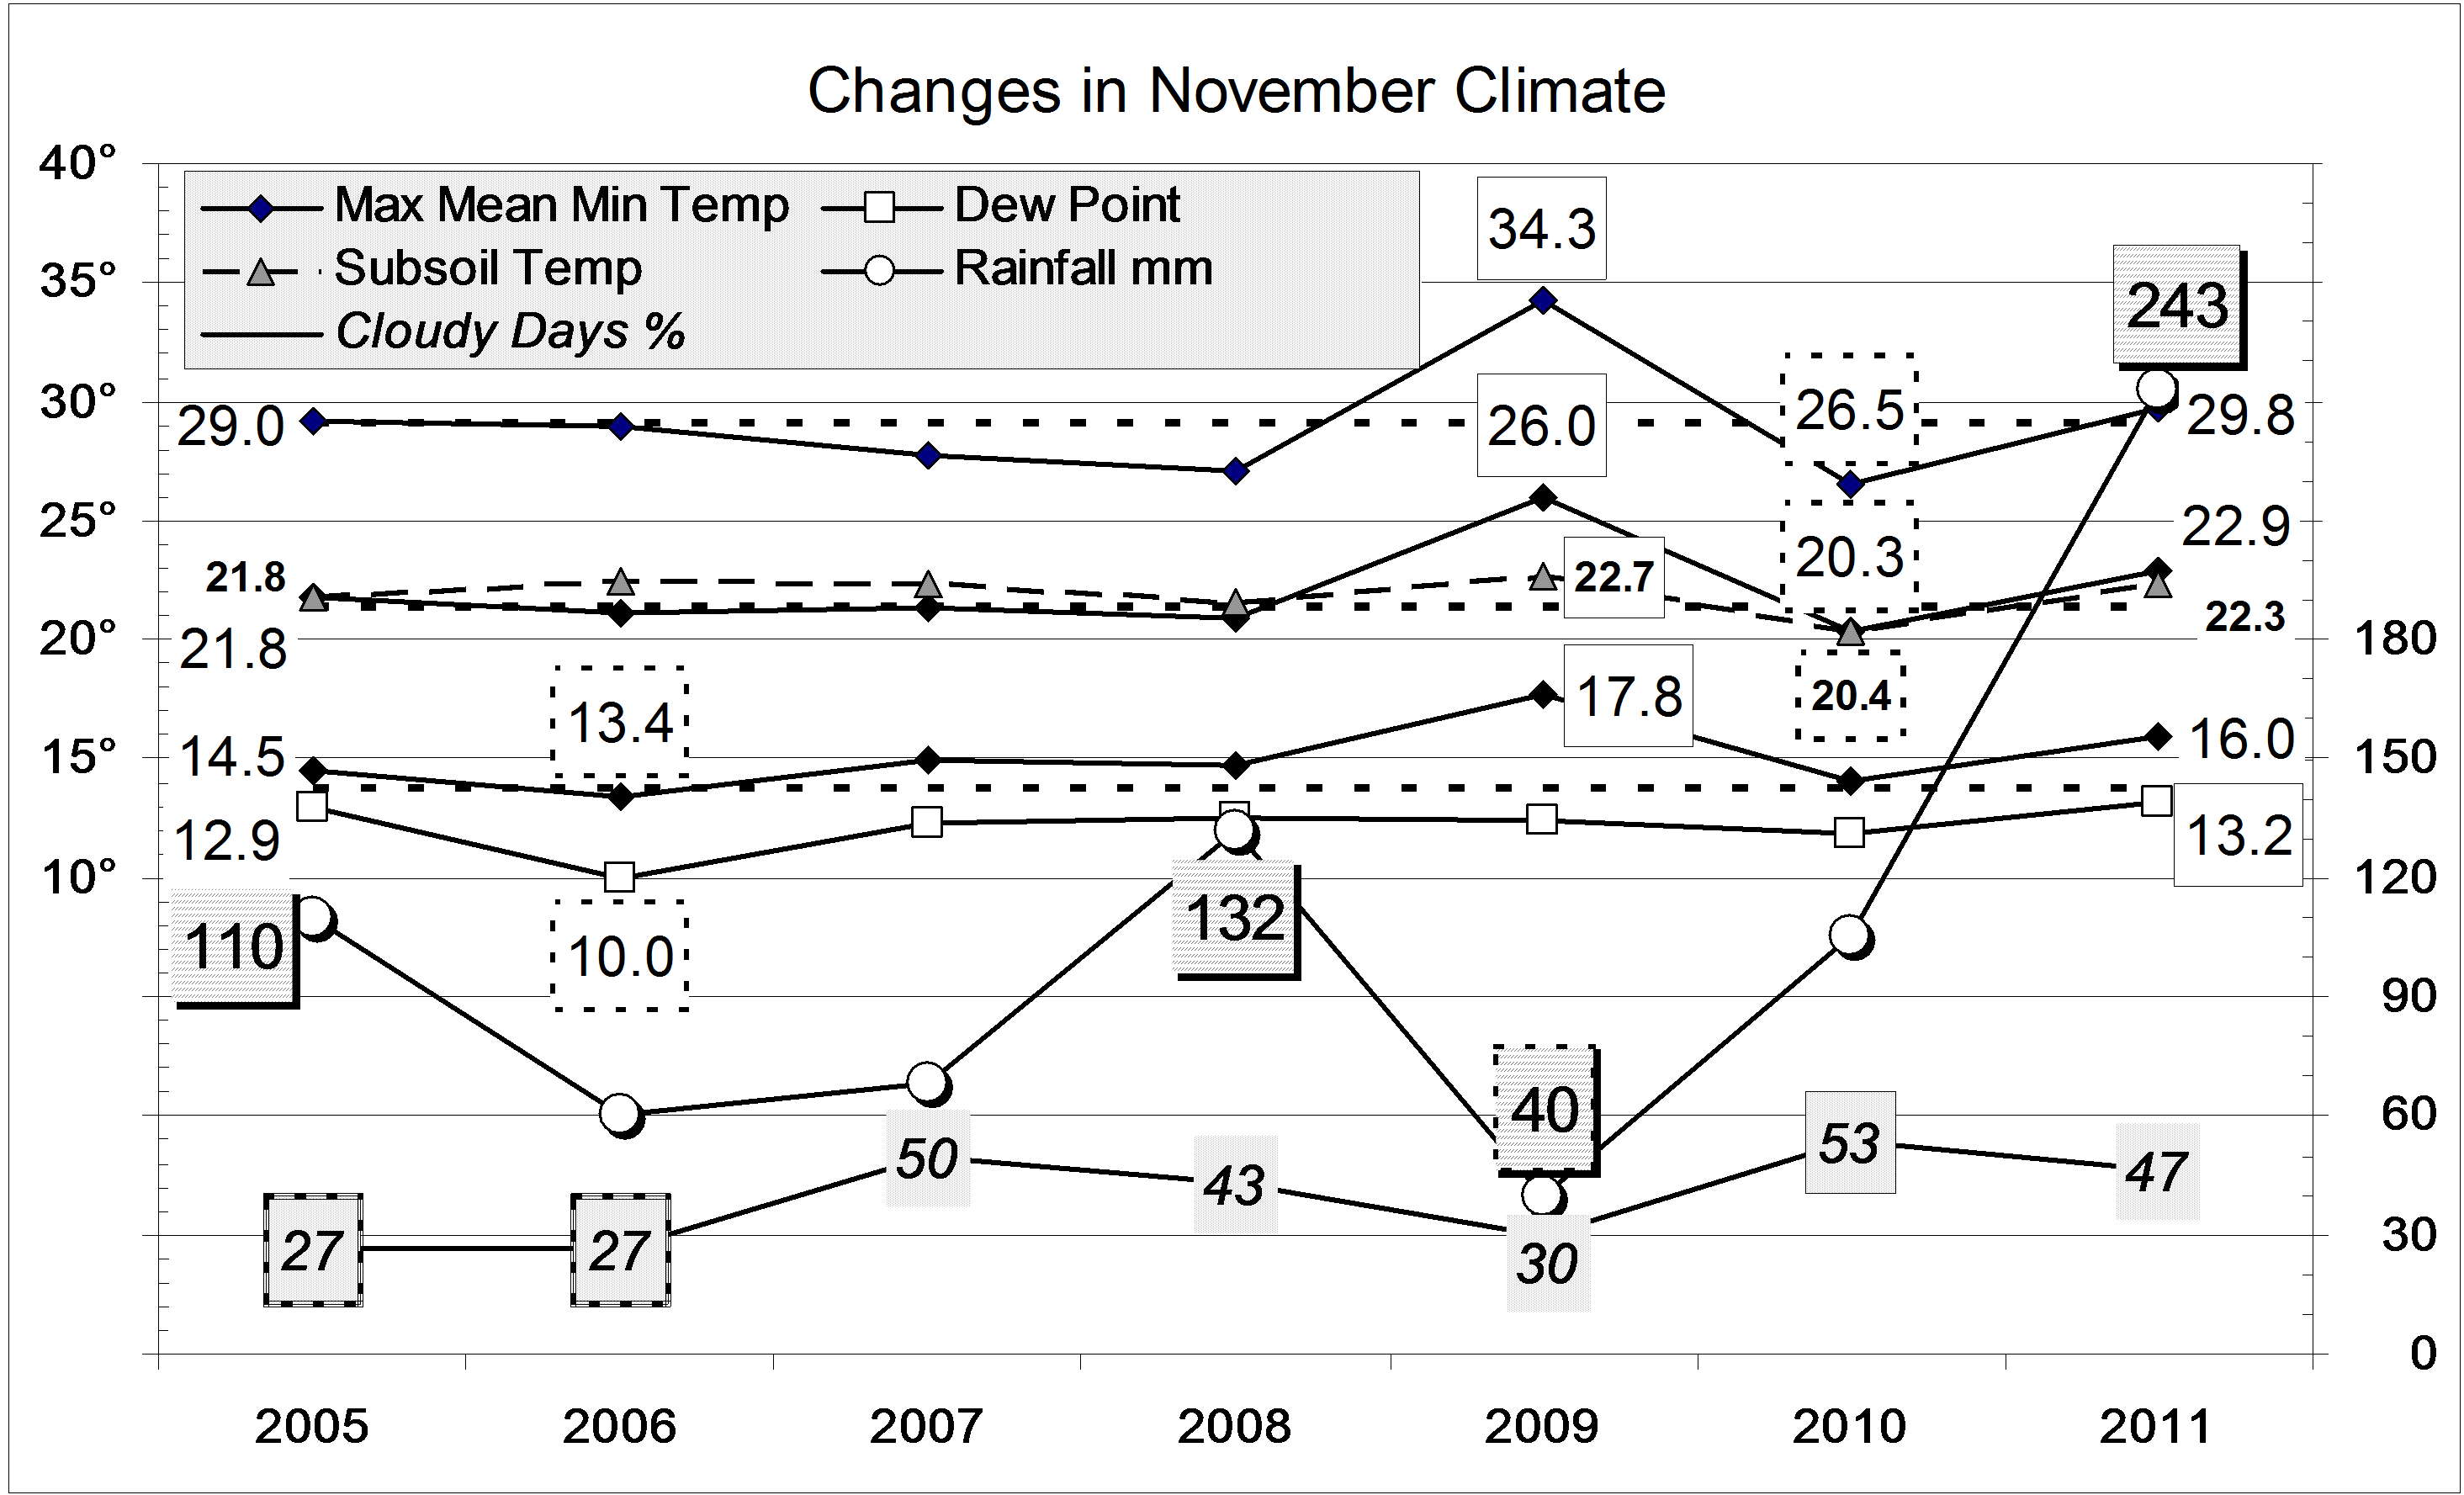
 This spring’s rainfall of 431.7 mm far exceeded that of any other spring in the record from 1883. Winter had been very dry, with only 55 mm. While there was a lot of rain in September (91.4 mm) and October (97.4 mm), much more fell in November (242.9 mm), mainly in the second half.