My better sun mirrors

By 11.30 sun mirrors fill the patio with reflected light.

By 11.30 reflected sunlight floods into the patio.

In my blog post “Mirrors to reflect the sun“, I described sun mirrors I put up to reflect winter sunlight to warm my house in NSW, Australia. They were just sheets of cooking foil taped to a north-facing courtyard wall, and I had to remove them each summer.
Now I have better and stronger mirrors: hinged panels that function winter and summer. In winter they reflect sunlight, and in summer they give shade.
These simple hinged mirror panels should improve the indoor climate due to my “Heat Control Courtyard“. Compared to heliostats (see links in a Note below) they are cheaper and will not set the house on fire!

This post is also available as a PDF file My better sun mirrors.

Materials

The mirror panels

I bought the mirror panels from builders supplies as “FoilBoard insulation panels”, 2440 mm X 1220 mm X 20 mm.

These are “aluminium composite bonded panels (ACP)” of rigid cellular expanded polystyrene (EPS) (20 mm) bonded between two layers of aluminium (less than 0.5 mm). One aluminium surface has 97% reflectance; the other is pre-finished in shades of green using a fluoropolymer resin paint system. [Cost of five panels: $230.]

Framing

The fragile FoilBoard insulation panels had to be stiffened with frames of aluminium angle, corner brackets, and braces of aluminium strip. [Cost: $380.]

Hinges

I had the panels mounted on ten “hinges” that allow them to be held in two positions:

(A) flush against the courtyard wall to reflect the sun to the house in winter, or

(B) raised above horizontal to provide shade in summer.

These are standard hardware items called “Whitco Window Stays”. [Cost for ten: $430.] Here, they operate as hinges, using friction to secure the mirror panels at any angle. [I must thank my builder, Keith Freeman, for selecting and using them in this way.]

Schedule

Work on the new sun mirror panels began on 1 December 2019 and ended on 24 January 2020. Labour cost about $1800, while materials (given above) cost about $1050.

As soon as the work was done, I set the mirrors to provide summer shade until the end of February 2020. Then I re-set them to reflect winter sunshine until now (2 September 2020).

The finished mirror panels

Photo dates

Because the effect of the mirror panels depends on the seasonal path of the sun, I took separate sets of photos in June, to represent the eight winter months (March to October) when they acted as mirrors and in February, to represent the four summer months (November to February) when they acted as shades. Photos of hinge details were taken in February.

Hinge details

Whitco window stays that form hinges to support sun mirror panels in winter are set here to make the same panels give summer shade.

These window-stay hinges are set to support both panels to give summer shade.

Whitco window stays form hinges to support house-warming sun mirror panels to make them also summer shade panels.

These window-stay hinges are set to support panels for winter warmth on the left, and for summer shade on the right.

Continue reading

House June warmth profiles: IV

Part IV: Solar gain in the clear-story


In a solar-passive house, do clear-story windows trap much heat?
How about overcast days?

Graph of clear-story temps, 2 days

[This post repeats some data of an earlier post, headed  “Part III: Daily temperature cycles, east wing”. Please refer to that post for more details.]

The graph above shows records of temperature for two days in mid-winter. Records of cloud cover (plotted in purple) show that the first day was overcast and the second mainly sunny.
Through the sunny second day, the temperature readings taken just inside the clear-story windows (black) rose and fell just like the outdoor temperature (red), but they were much higher. I have drawn a dotted red line at a temperature 13.5° higher than outdoors. It fits well to the clear-story temperature (black) on that day. During the previous day, which was overcast, the dotted red line does not fit. It is about 6° higher than the actual clear-story temperature.
By experiment, I found that I could make a model (plotted in green) that would match the actual clear-story temperature as the cloud cover changed. As well as adding 13.5° to the outdoor temperature, I subtracted two thirds of the cloud cover measured in octas. As plotted (green), this model matches the clear-story temperature through both days. At two data points there was a mis-match: those points have not been plotted.

 Graph of clear-story temps, 5 days

The second graph shows all five days of the experiment. My model of temperature in the clear-story space (plotted green), fits the actual readings (black) on all days.

Photo of clear-story area with winter sun and a fan

Clear-story fan set for winter

The model includes one other feature: the maximum temperature that I allow is 26°. That also matches. As mentioned in Part III, a thermostat turns on fans at 26°. That prevented the temperature from rising higher.

Comment

A solar passive house is likely to gain more winter heat if it has north-facing windows in a clear-story above room level. It may also lose more heat. If so, the cost of the clear-story design may not be justified.
This experiment shows that, in this particular house during one harsh winter, the clear-story performed very well.

People may be as surprised as I was at the closely-matching pattern of outdoor and clear-story temperatures in mid-winter, and at how very much warmer the clearstory was: more than thirteen degrees warmer in fine weather.
It may also provoke some thought that the match persisted in overcast weather, but with the clearstory being only eight degrees warmer than outdoors in that case.

Back to Part I: Average temperature values.
Back to Part II: The two-storied west wing’s daily temperature cycles
Back to Part III: the single-storied east wing’s daily temperature cycles

Courtyard wicket gates

Courtyard wicket gate half open

View East Through Wicket Gate

This small courtyard has been described on its own page: “A Heat-control Courtyard”.

Built to help control the indoor climate, it is enclosed by solid walls and solid gates made of a sandwich of fibre and polystyrene.
At times when free circulation of air is wanted, the gates can be latched open. That has the disadvantage that dogs and small children can pass in and out.
I have now made the control of air separate from the control of traffic by adding a wicket gate in each gateway.

The first photo (above) is a view of the courtyard as one would enter it from the west. Both main gates are open. The west wicket gate stands partly open, and the east wicket gate is closed.

Courtyard wicket gate bolted open.

West solid gate closed and wicket gate bolted open.

The second photo, taken from just inside the courtyard, shows the west main gate closed to prevent the flow of air. The wicket gate is fully open, as it would be in that case, secured there by its drop bolt.

Courtyard seen through the east wicket gate

Courtyard through east wicket gate


In the third photo, the courtyard is seen through the open east main gate and the bars of the closed east wicket gate.

These photos were taken on the 1st of August 2017 at 10:30 am. They show the courtyard receiving sunshine that passes over the roof of the house, as it does during winter mornings. Some sunshine is direct, some reflecting diffusely off the wall, and some reflecting brightly off mirrors of aluminium foil.

Two thermometer screens can be seen in the third photo. I am monitoring temperatures to find if the courtyard is affecting the indoor climate. As an experiment, I keep the main gates open or closed in alternate months. When gates were open in a particular month of the first year, they are closed in that month of the next year.


The wicket gates are made of welded, pre-galvanised steel tube in the style “Pool’nPlay Flattop”, powder-coated in white. They were supplied and installed in July 2017 by Bluedog Fences for $1793.

Adaptive Comfort

The Adaptive Comfort Standard of ASHRAE

Adaptive Comfort Zone graph

You need to know what range of temperature you are likely to find comfortable when you are planning a house or its heating and cooling. This graph is a guide to the temperature range for comfort.

The graph explains itself. People are comfortable at rather higher temperatures in places, or at times of year, when the climate is warmer. They are comfortable at lower temperatures if the climate is cooler.
For any month in any place, you must simply look up the mean temperature for that month. Then 90% of all people will feel comfortable at temperatures in the five-degree range between the magenta line and the green line. At temperatures in the seven-degree range between the red and blue lines, 80% of people will feel comfortable.

Generally, using the local mean temperatures for January and July will give enough information for your planning. Sydney provides an example:

Because the Sydney mean temperature in the coldest month, July, is 13°, 80% of people will remain comfortable if a house gets no colder than 18°.

Because the Sydney mean temperature in the hottest month, January, is 23°, 80% of people will remain comfortable if a house gets no hotter than 29°.

The adaptive comfort zone shown on the graph was proposed by Richard de Dear and Gail Schiller Brager (2001).
This adaptive comfort zone has been incorporated in the de facto international standard: ANSI/ASHRAE Standard 55-2004, Section 5.3,, as summarised here. 

By this innovation, the American Society of Heating, Refrigeration, and Air-conditioning Engineers (ASHRAE) recognised publicly that full climate control of buildings at one “ideal” temperature and humidity may not be the way of the future.

One-year record of indoor and outdoor means
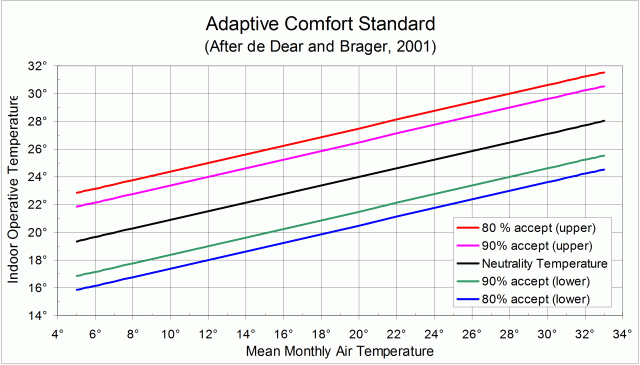
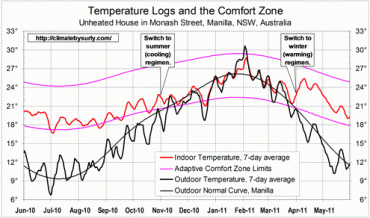
I have used this Adaptive Comfort Standard in many of my posts, notably the one showing how my house maintained a temperature almost completely within the Comfort Zone through a whole year.


This material, with its graph, was posted originally to a “weatherzone” forum more than seven years ago. Unfortunately, the photo-hosting website “Photobucket” has now withdrawn the image from public use. This post is to make it available again.

In November 2019, the weatherzone forum was closed due to lack of public interest.

House June warmth profiles: III

Part III: Daily temperature cycles, east wing

Graph showing the daily temperature cycles for five days at mid-winter

This five-day period was a testing time for the unheated solar-passive house. Days were at their shortest, some nights were frosty, and overcast persisted for two days. It fell within a cold, wet, and cloudy winter.

This post is about the single-storied east wing of the house. It is the main part of the house, with most of the clearstory windows.

Back to Part I: Average temperature values.

Back to Part II: Daily temperature cycles, west wing

Forward to Part IV: Solar gain in the clear-story

Observations

View of the house from the street

House From the Street

In this wing, seen on the left in the photo, five thermometer stations define a profile in height. They are:

Subsoil in the heat bank beneath the house;
On the floor slab;
On the room wall;
In the clearstory space;
OUTDOORS, in a Gill Screen, 1.5 metres above the ground and eight metres from the house.

During the five days I made 84 observations at each station at intervals as shown. They define the daily temperature cycles. I observed the amount of cloud in Octas (eighths of the sky) at the same intervals.

Table of east wing temperatures.This table lists for each thermometer station the five-day values of the average, maximum, and minimum temperatures, and the temperature range.

The daily cycles

Subsoil

Continue reading