
In my post of 18 Sep 2014 “The record of the IPO”, I showed a graph of the Inter-decadal Pacific Oscillation,plotted as a cumulative sum of anomalies (CUSUM).
 This CUSUM plot has a shape that makes it seem that it could be used to straighten the dog-leg (zig-zag) trace of global temperature that we see. A straighter trace of global warming would support the claim that a log-linear growth in carbon dioxide emissions is the main cause of the warming.
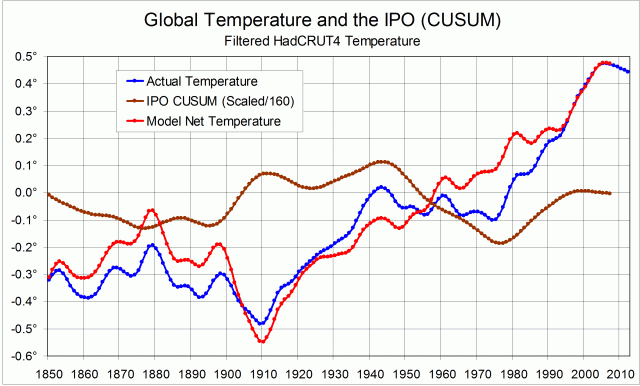
My attempt to straighten the trace depends on the surmise (or conjecture) that the angles in the global temperature record are caused by the angles in the IPO CUSUM record. That is, the climatic shifts that appear in the two records are the same shifts.
I have adopted an extremely simple model to link the records:
1. Any global temperature changes due to the Inter-decadal Pacific Oscillation are directly proportional to the anomaly. (See Note 1.);
2. Temperature changes driven by the IPO are cumulative in this time-frame.
To convert IPO CUSUM values to temperature anomalies in degrees, they must be re-scaled. By trial and error, I found that dividing the values by 160 would straighten most of the trace – the part from 1909 to 2008. (See Note 2.) The first graph shows (i) the actual HadCRUT4 smoothed global temperature trace, (ii) the re-scaled IPO CUSUM trace, and (iii) a model global temperature trace with the supposed cumulative effect of the IPO subtracted.
The second graph compares the actual and model temperature traces. I note, in a text-box, that the cooling trend of the actual trace from 1943 to 1975 has been eliminated by the use of the model.
The graph includes a linear trend fitted to the model trace for the century 1909 to 2008, with its equation: y = 0.0088x – 0.9714 and R² = 0.9715.

This great result comes at a high price. In the earlier part of the graph, from 1850 to 1909, the model trace becomes more crooked than the actual trace. I have chosen to express this bad result by fitting a second trend line (parallel to the first) to the part of the model curve from 1850 to the climate shift at 1879. The fact that this earlier global warming trend is 0.6 degrees higher than the later trend, a cooling assigned to just 30 years, undermines my conjecture.
[Note added 21 September 2018.
See also the later post: “Global Warming Bent-line Regression” of 12 May 2017 for further discussion.]
Note 1. The positive phase of the IPO has maximum sea surface temperatures along the equator in the Pacific Ocean (See Figure). This phase may well be optimal for transfer of heat from ocean to atmosphere.
Note 2. The re-scaling factor is not critical. Values from 120 to beyond 170 all give R² values above 0.97. The chosen factor of 160 gives the least curved parabolic trend line. A re-scaling factor of 100 makes the model trace steeper in the interval 1945 to 1973, in agreement with the observed increased logarithmic rate of emissions between those dates.

Pingback: Hammering Global Warming Into Line | Gaia Gazette