My Heat-control Courtyard

Photo of a small courtyard

A Heat-control Courtyard

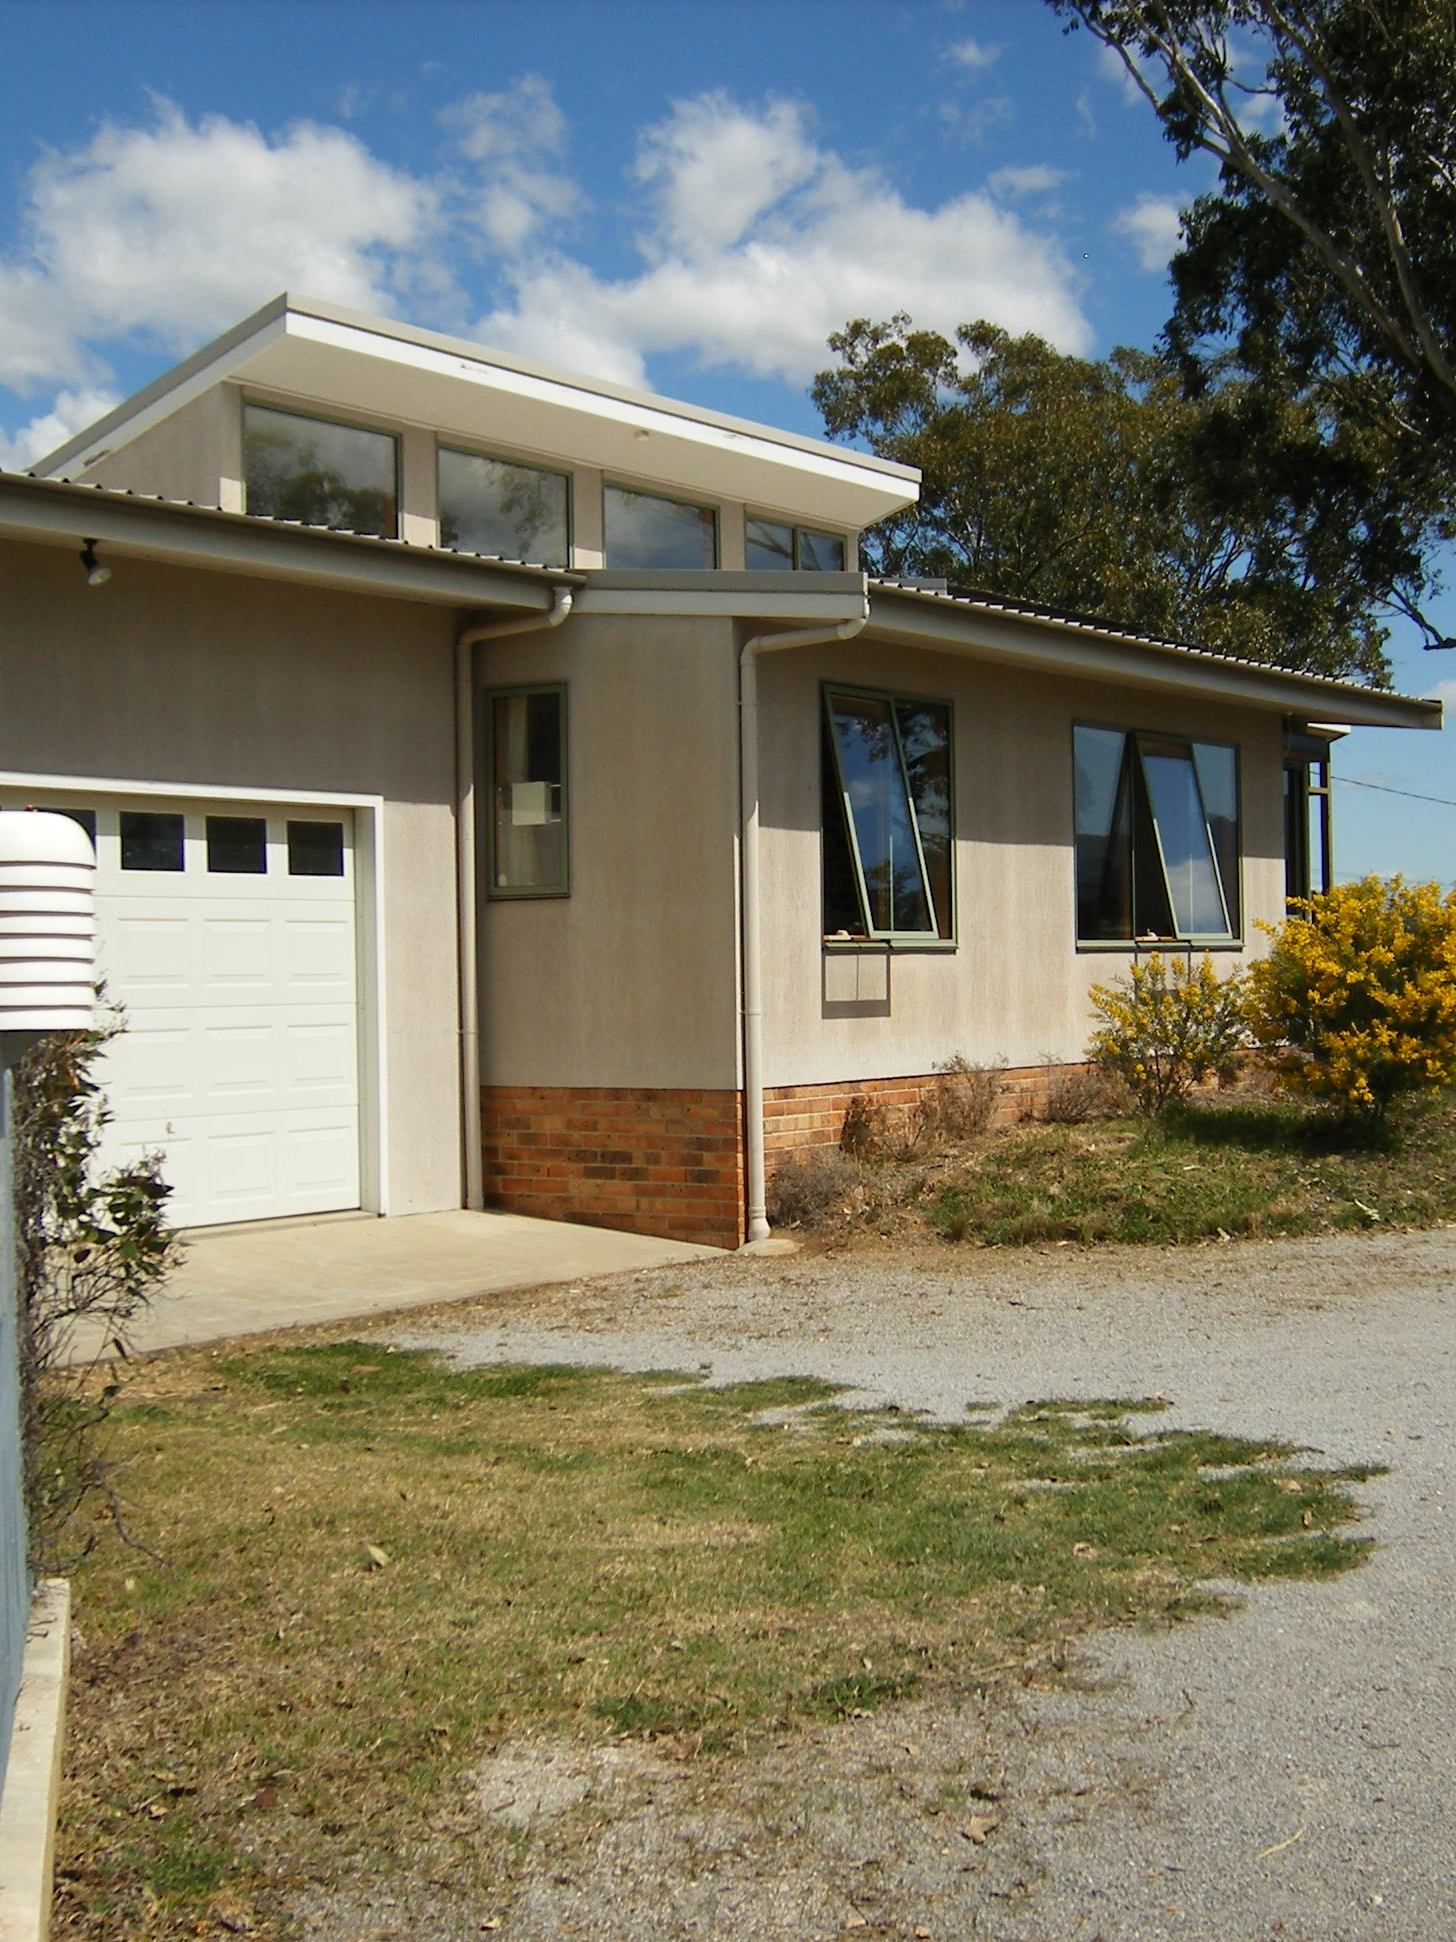
I have added a courtyard to my high-mass solar-passive house to improve summer cooling and winter heating.

Photo of building materials

Courtyard Wall Panels and Gates

The courtyard extends 13 metres along the south wall of the house. It is completely enclosed by a wall of white-painted polystyrene sandwich panels 1.8 metres high, with two gates of the same material.

By September 2015 trenches had been dug for the courtyard foundation, and by December it was complete.

Photo of trenches dug for courtyard

Courtyard Trenches, West

Photo of trenches dug for courtyard

Courtyard Trenches, East

Operation

This house is in BCA Climate Zone 4: Hot dry summer, cool winter. For comfort, it must be made very much cooler in summer and very much warmer in winter. The courtyard was built to help to achieve both results without the use of heaters or coolers.
In summer, it should ensure a supply of very cool air at night. In this house, cool air is drawn in to replace warm air that flows out the clear-story windows by the stack effect, assisted by fans. By day, the courtyard walls also block some solar radiation.

Photo of courtyard from the west

The Courtyard Through The Western Gate

In winter, the white courtyard wall reflects sunshine north towards the house, and re-radiates heat lost from the house wall back towards it.

More

Much more detail is given in the page “A Heat-control Courtyard”. All photos on this topic are in a gallery in “House Photos – 2016”.

New Post on Wicket Gates

In August 2017 I added a new post about wicket gates that were added to the solid gates in the courtyard gateways.


To invite discussion of how courtyards can affect indoor and outdoor climate of houses, I opened a thread “Courtyards for Climate Control” on the forum of the Alternative Technology Association (ATA) based in Melbourne.

House Thermal Mass Works in Summer Too

House temperature ranges diagram

My house at Manilla, NSW, is in a climate with temperatures that are extreme, but comfortable on the average. To reduce extreme temperatures indoors, the house contains more than a hundred tonnes of thermal mass within a shell of insulation.
The “thermal mass” is the materials, such as bricks, stones, concrete, earth or water, that have high thermal capacity (See Notes below): they take in and give out a lot of heat.
Many people, who can see that having thermal mass inside a house will help to keep it warm in winter, think that the thermal mass will make it hard to keep the house cool in summer. They see many brick and brick-veneer houses in which thermal mass is exposed to the intense heat of the summer sun. In that case, thermal mass material does no good.

In this graph, I have used my last twelve months of temperature data to show the benefit of well-insulated thermal mass in summer as well as in winter.
Outdoor temperature in this year went as low as minus 4.0° Celsius and as high as plus 43.7°: a range of 47.7°. Continue reading

January “Coolth” in a House without Air-Conditioning

I have now 15 years of January average temperature data for my house at Manilla, North-west Slopes, NSW. These graphs show how the house temperature relates to the outdoor (or ambient) maximum, mean, and minimum temperatures.Regression graphs of indoor on outdoor temp in the hottest month

The house is not too hot and not too cold

Solar-Passive House from the NE.

House at Monash St Manilla from NE

In January (the hottest month) the rooms* in this solar-passive house do not heat up much during the day, nor do they cool down much at night. Since the indoor temperature always rises and falls just one or two degrees from the mean, only the mean is shown. Green lines on the graphs, which are drawn to pass through the middle of each cloud of data points, show by how much (on the average) the indoor temperatures have differed from the outdoor maximum, mean, and minimum temperatures. On the middle graph the green line shows that the rooms have been 0.5° cooler than the mean temperature outdoors. The left graph shows that the rooms have been 8.2° cooler than the daily maximum outdoor temperatures. The right graph shows that the rooms have been 7.3° warmer than the daily minimum overnight temperatures.

The design of the house aimed to protect those living there from excessive summer heat. It may seem that reducing the mean temperature by only half a degree is a failure. Not so! The January mean temperature at this site (26.1°) is near the middle of the adaptive comfort zone for this month, and so is the indoor mean temperature (25.6°). The house succeeds in keeping the indoor temperature comfortable in the heat of the day, when that outdoors is an uncomfortable 34 degrees. The high thermal mass that achieves this has the unfortunate result that the minimum indoor temperature overnight (not shown) is some five degrees warmer than the outdoor minimum. However, on average, it is still a comfortable 23.5 degrees. (Curiously, no-one knows the best room temperature for sleep.) Continue reading

July Warmth in an Unheated House

Solar-Passive House from the NW

House at Monash St Manilla from NW

I have fifteen years of temperature data for my high-mass, solar passive, unheated house at Manilla, NSW, Australia. This article has been posted previously here. These graphs show how July temperatures indoors relate to those outdoors. Indoor maxima and minima are not shown, because they are consistently between one and two degrees above and below the indoor mean.

House and ambient temperatures, 15 July months. The house is much warmer (dashed green lines)

In July, the rooms* in this solar-passive house, heated only by the sun, are much warmer than outdoors. This is shown by the green lines on the graphs, which are drawn to pass through the middle of each cloud of data points. The middle graph shows that, as an average over 15 July months, the rooms have been 8.7 degrees warmer than outdoors. The left graph shows that the rooms have even been 1.4 degrees warmer than the daily maximum outdoor temperatures. The right graph shows that the rooms have been nearly sixteen degrees warmer than the daily minimum overnight temperatures. To stay warm in this way the house must have absorbed many hundreds of kilowatt hours of heat from the sun. I have burned a few kilowatt hours of grid power to maintain my comfort, but this cannot have warmed the house by as much as one tenth of a degree in any month. Continue reading

Indoor/Outdoor Regressions for Maxima and Minima

Regressions for maximum and minimum temperatures compared

This graph shows the two regression lines for Indoor versus Outdoor daily maximum temperature (purple) and daily minimum temperature (green), taken from separate scatter-plots for maxima and minima. I have marked three points on each line: the mean temperature point and points at the extreme ends of the lines, one for a very hot day and one for a very cold day.

The interest of this graph is in the space between the regression lines. It represents the daily temperature range. I have linked each pair of points by two lines like the tread and riser of a stair. The tread (red) is the outdoor daily temperature range; the riser (blue) is the indoor daily temperature range.

The mean outdoor temperature range here is 15.4° and the mean indoor temperature range of the house is 3.1°. By this measure, the indoor temperature range is one fifth of that outdoors.
It happens that, in Manilla, the outdoor temperature ranges in the hottest and coldest parts of the year are, as shown, slightly less than for the year as a whole. Indoor temperature ranges show a clear gradient, from as much as 3.7° on a very hot day through 3.1° at the mean, to only 2.3° on a very cold day.

These very narrow temperature ranges result from the way the high thermal mass dispersed within the house allows heat to be absorbed and radiated at room temperature, eliminating extremes. Hot spots and cold spots are few and do not last long.

Adaptive Comfort

[I have re-posted the lost graph of the Adaptive Comfort Zone here.]

For comfort, we do not need indoor temperature ranges as narrow as these. Using the Adaptive Comfort Zone model we find that the neutrality temperature (for best comfort) based on Manilla’s January mean temperature of 26°  is also 26°, and the neutrality temperature based on Manilla’s July mean temperature of 10° is 21°.
According to the model, 80% of the population feel comfortable when the temperature is within 3.5° of the neutrality temperature: in January at Manilla they are comfortable up to 29.5°, and in July they are comfortable down to 17.5°.
My graph shows that the maximum indoor temperature of this house on a very hot day (29.9°)is only 0.4° above the January comfort limit, and the minimum indoor temperature on a very cold day (15.8°) is just 1.7° below the July comfort limit.
On this model, most people could live comfortably in this house using heating or cooling for only a few days in a year.
This post is one of a set of four back-dated to June 2010:
Indoor versus Outdoor Temperatures (1096 days)
Indoor versus Outdoor Minima (1096 days)
Indoor versus Outdoor Maxima (1096 days)
Indoor/Outdoor Regressions for Maxima and Minima (This post.)


This article was originally posted in the weatherzone forum thread “Indoor Climate” on 9th June 2010. It is backdated here to 19th June 2010.