
I have now 15 years of January average temperature data for my house at Manilla, North-west Slopes, NSW. These graphs show how the house temperature relates to the outdoor (or ambient) maximum, mean, and minimum temperatures.
The house is not too hot and not too cold
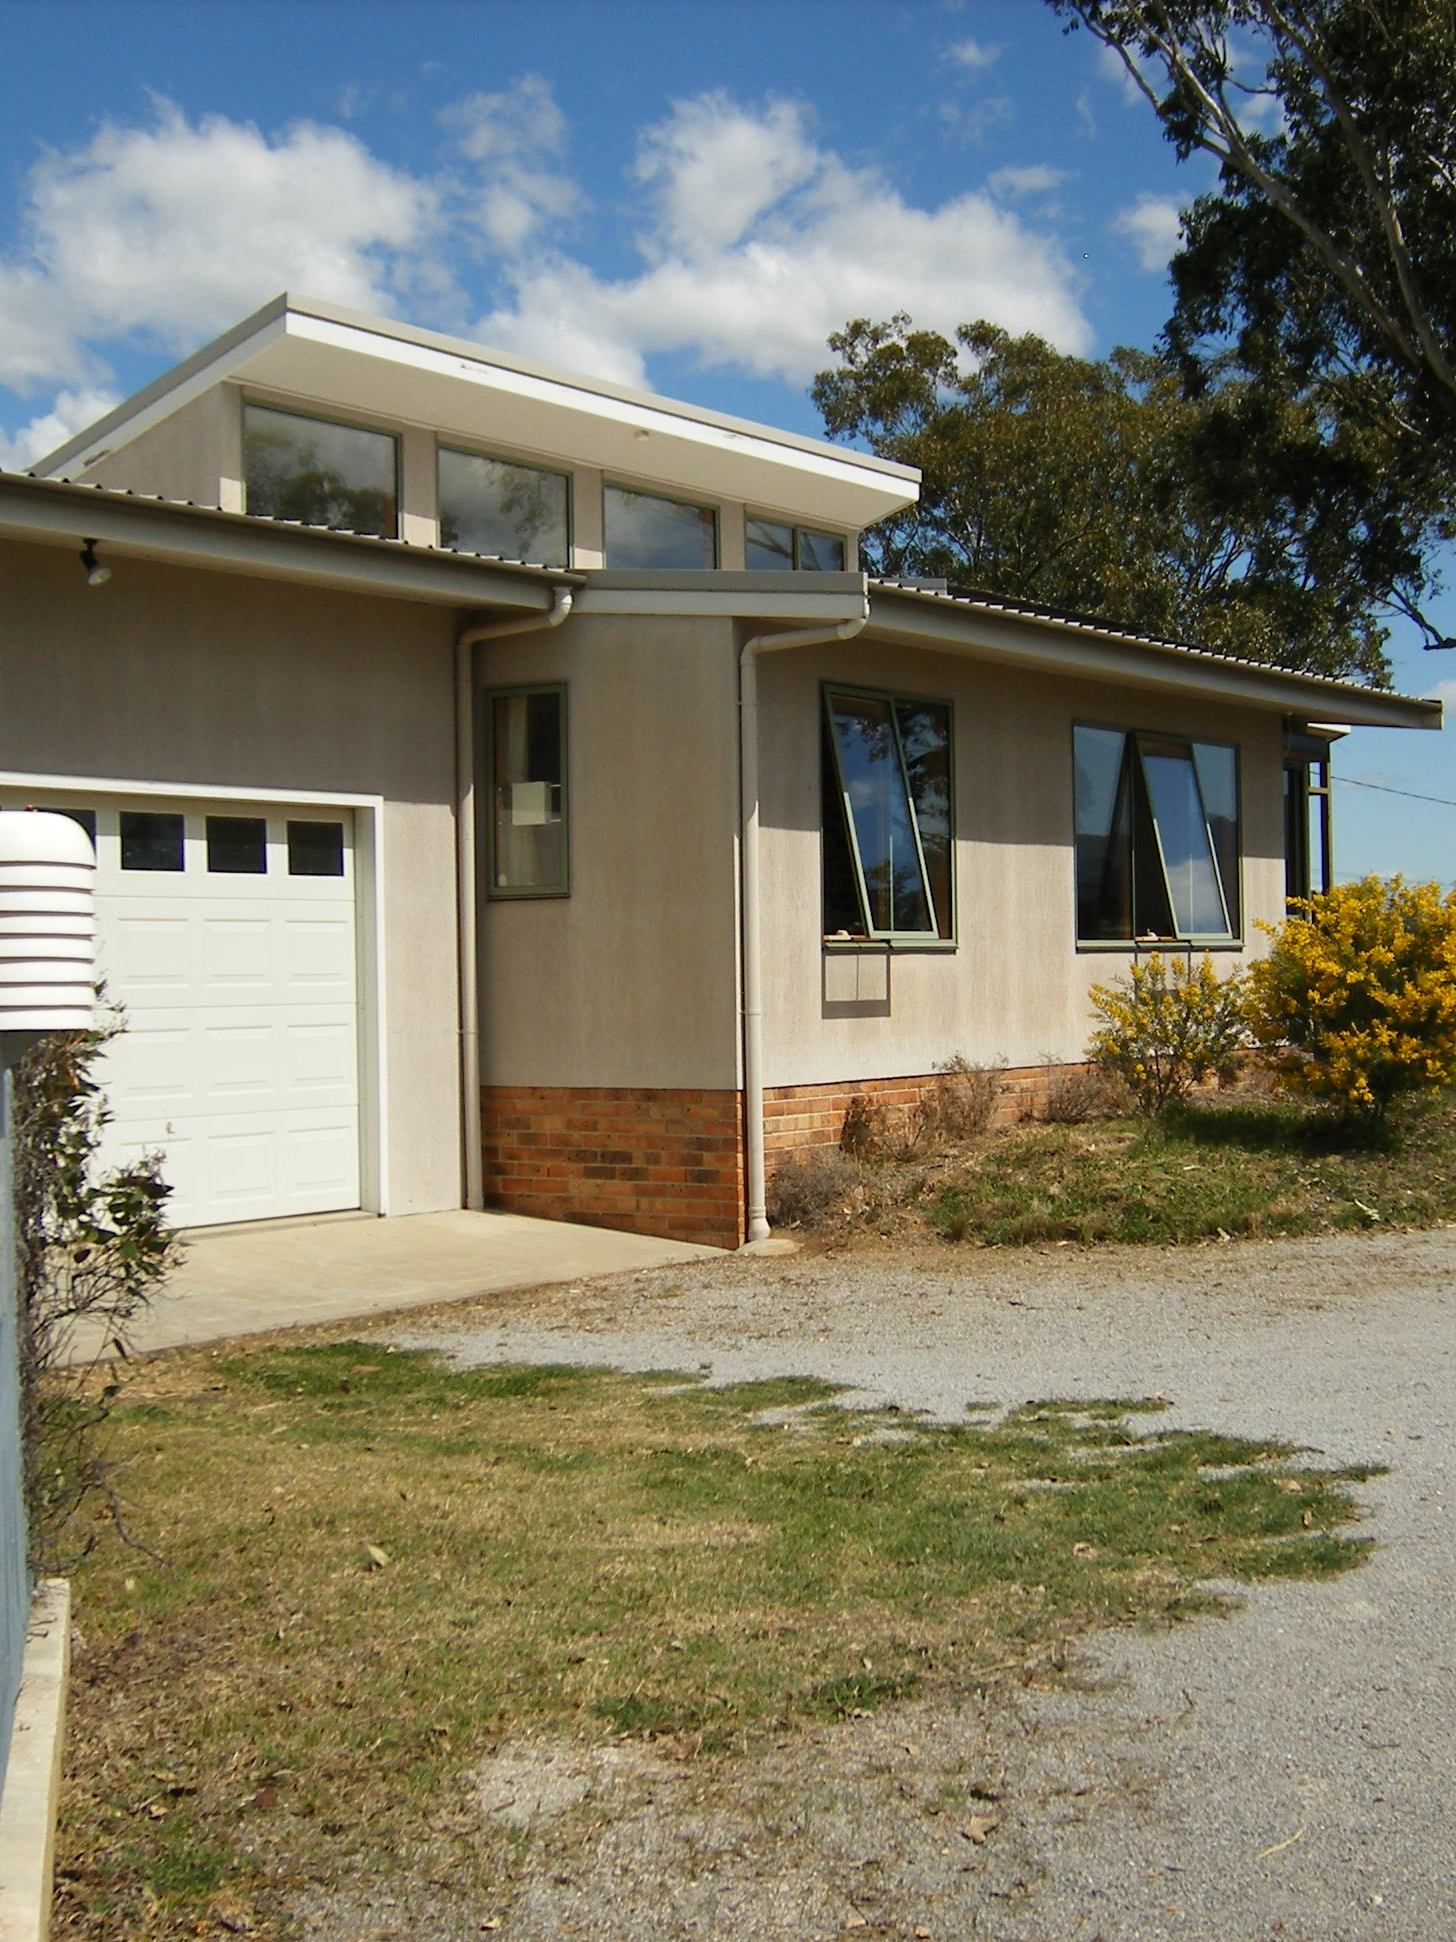
House at Monash St Manilla from NE
In January (the hottest month) the rooms* in this solar-passive house do not heat up much during the day, nor do they cool down much at night. Since the indoor temperature always rises and falls just one or two degrees from the mean, only the mean is shown. Green lines on the graphs, which are drawn to pass through the middle of each cloud of data points, show by how much (on the average) the indoor temperatures have differed from the outdoor maximum, mean, and minimum temperatures. On the middle graph the green line shows that the rooms have been 0.5° cooler than the mean temperature outdoors. The left graph shows that the rooms have been 8.2° cooler than the daily maximum outdoor temperatures. The right graph shows that the rooms have been 7.3° warmer than the daily minimum overnight temperatures.
The design of the house aimed to protect those living there from excessive summer heat. It may seem that reducing the mean temperature by only half a degree is a failure. Not so! The January mean temperature at this site (26.1°) is near the middle of the adaptive comfort zone for this month, and so is the indoor mean temperature (25.6°). The house succeeds in keeping the indoor temperature comfortable in the heat of the day, when that outdoors is an uncomfortable 34 degrees. The high thermal mass that achieves this has the unfortunate result that the minimum indoor temperature overnight (not shown) is some five degrees warmer than the outdoor minimum. However, on average, it is still a comfortable 23.5 degrees. (Curiously, no-one knows the best room temperature for sleep.)
Which of the outdoor temperatures affect the room temperature?(dashed black lines)
On each graph there is a dashed black line and an equation (from Excel charts) showing how the room temperature relates to the outdoor temperature (Max, Mean, or Min) that is plotted along the bottom.
On these January graphs, the points line up from bottom left to top right very much better than on the July graphs. The R-squared values are all much higher, ranging from 0.62 for maxima to 0.97 for minima. To explain, I can only suggest that even this house has limited ability to reject the extreme solar radiation of this climate in summer. The night-time relation (on the right) is the closest by far: each degree that the outdoor daily minimum falls produces a 0.87 degree fall of indoor temperature. To say simply that the January temperature of the house is 7.3° higher than the outdoor daily minimum temperature is correct. (The regression of room mean temperature on outdoor minimum temperature, when constrained to have a gradient of 1.00, is y = x+7.3, with R-squared = 0.94.)
Why is it so?
In summer the house has many defences against high ambient temperature and solar radiation in daytime. It is well insulated and well sealed. There are air-locks at the main doors. No windows receive summer sun, and automated curtains are kept closed against stray radiation during the day. Morning and evening shade is given by trees, shrubs, vines, water tanks, awnings, porches and attached garages. An effective thermal mass of over 100 tonnes carries coolness from spring into summer. However,the house is still affected by daytime conditions to some extent.
By night, warm air in the house is “purged” by intentional use of the stack effect that results from air buoyancy. To let in cool air, external doors at ground level are opened at bed-time (and closed on getting up). [In 2016, I had an automated louvre window installed low in a south-side wall to make it unnecessary to open and close the doors.] Warm air is vented through high clear-story windows that are kept open, and air is blown out through them by fans that run from midnight to 5 am. It is this night purge that links the house temperature so strongly to the outdoor minimum temperature. Two factors prevent the house from getting as cool as the pre-dawn outdoor minimum:
1. The air outdoors is near minimum temperature only for a short time;
2. The mass of the house takes a long time to cool down. The cooling effect of the air flow is not lost, though, because it ensures that the daily and summer season heating of the floor slab is reduced.
Warm and cool January months
At Manilla, January 2013 and January 2014 had (on average) the hottest days in the 15 years, and January 2012 and January 2008 the coldest. Inside the house, January 2013 was the hottest, but January 2012 was only the second-coldest, and the other two months were not extreme.
As the third graph shows, the January month with the warmest nights (2013) was also the warmest indoors, the one with the coolest nights (2000) was also the coolest indoors, and the others kept almost the same sequence in between.
Speaking of climate change, hotter summer days might cause more heat-stroke, but would not over-heat solar passive houses, because they are well protected in daytime. Hotter summer nights, although less likely to cause heat-stroke, would over-heat solar-passive houses, by making purging with cool night air less effective.
This post, with January (mid-summer) data for this solar-passive house is one of a pair. July (mid-winter) data are in the post “July Warmth in an Unheated House”.
*Room temperature is mean daily room temperature, measured at head height on an internal stud wall. The daily temperature range at that point in January is only 3.8°. Outdoor (ambient) temperatures are measured in the Gill-type screen seen in the photo.

no-one knows the best room temperature for sleep? It’s probably quite different for those who prefer pyjamas and a cuddly doona to no clothes and no doona! Since we cannot sleep when we are uncomfortable, the “best temperature” is probably a wide band on the chart.
I have found only two studies (by the same authors) of the temperature that is comfortable for sleeping. The second one is:
“A study on the thermal comfort in sleeping environments in the
subtropics—Measuring the total insulation values for the bedding
systems commonly used in the subtropics” by Zhongping Lin and Shiming Deng, Building and Environment 43 (2008) 905-916. (I paid Elsevier $35.95 for it.)
In line with your comment, Alison, Lin and Deng found that “The total insulation values of the measured bedding systems varied greatly from 0.90 to 4.89 clo, depending upon bedding, bed and mattress, the type of sleepwear, and percentage coverage of body surface area by bedding and bed.”
Their lowest measured insulation condition of 0.90 clo was for no pyjamas, no blanket and a primitive mattress; the highest measured insulation condition of 4.89 clo was for long pyjamas, a thick quilt and a modern mattress.
The authors comment that, in their other paper, they found that, in an 0.90 clo case, the best (thermally neutral) room temperature would be 30.1°C, while in a 4.89 clo case, the best room temperature would be 8.9°C.
In this experiment (in Hong Kong), the authors kept the room and its surfaces at 22°C, the relative humidity 50% and the airflow below 0.15 m/s. These conditions may be near the ideal for sleeping with light sleepwear and bedding.
Interesting. I concur with 22C for a room I want to cool with an air conditioner. That’s what I set the temp to when I have light pyjamas and a light cover and it’s hot outside. For a room I want to heat when it’s cold outside, I prefer heating to about 17C and using a warm cover, because heated air is not so nice at 22C. Another variable is whether the air moves or not. A fan can make a hotter room sleepable. If I have no fan, no A/C and no heating, I guess a comfortable range would be 15 – 22C. But that’s just me.