[I posted an Up-dated version of this graph in July 2014]
Up-to -date data on global temperature change can easily be down-loaded from Ole Humlum’s website “climate4you“.
Humlum favours sampling windows 37 months wide. For my own data at Manilla, NSW, I have always used windows about six months wide, which show up Australia’s vigorous Quasi-biennial oscillations of climate. I tried Humlum’s 37-month window on my data, with quite startling results, as shown in the graph above.
Humlum re-presents three records since 1979 of global monthly air surface temperature anomalies:
* HadCRUT3: by the (UK Met Office) Hadley Centre for Climate Prediction and Research, and the University of East Anglia’s Climatic Research Unit (CRU), UK.
* NCDC: National Climatic Data Centre, NOAA, USA.
* GISS: Goddard Institute for Space Studies, Columbia University, New York, NASA, USA.
When smoothed by a 37-month running average, these data sets give very similar results. I use the GISS data because it matches my data best.
The match is very good, particularly in the sharp fall from the maximum in April 2006 to the minimum in September 2007. Where my data begins in September 2000, both curves rise steeply from low values, but mine peaks in August 2001, more than a year before a corresponding peak in global temperature (September 2002). After that, there is a plateau, where the graphs rise together to the highest peak (April 2006).
The other global data sets, HadCRUT and NCDC, have temperature falling or steady along the 2002-2006 plateau.
There are two reasons for plotting my data on a separate axis (on the right). First, the reference periods are different: GISS uses 1951-1980, while I use the decade from April 1999. Second, temperature varies much more at a single station than in the average of many stations around the world. I use a scale six times larger.
It turns out that the cold time in Manilla in late 2007, which I had mentioned in several contexts, was a cold time world-wide.

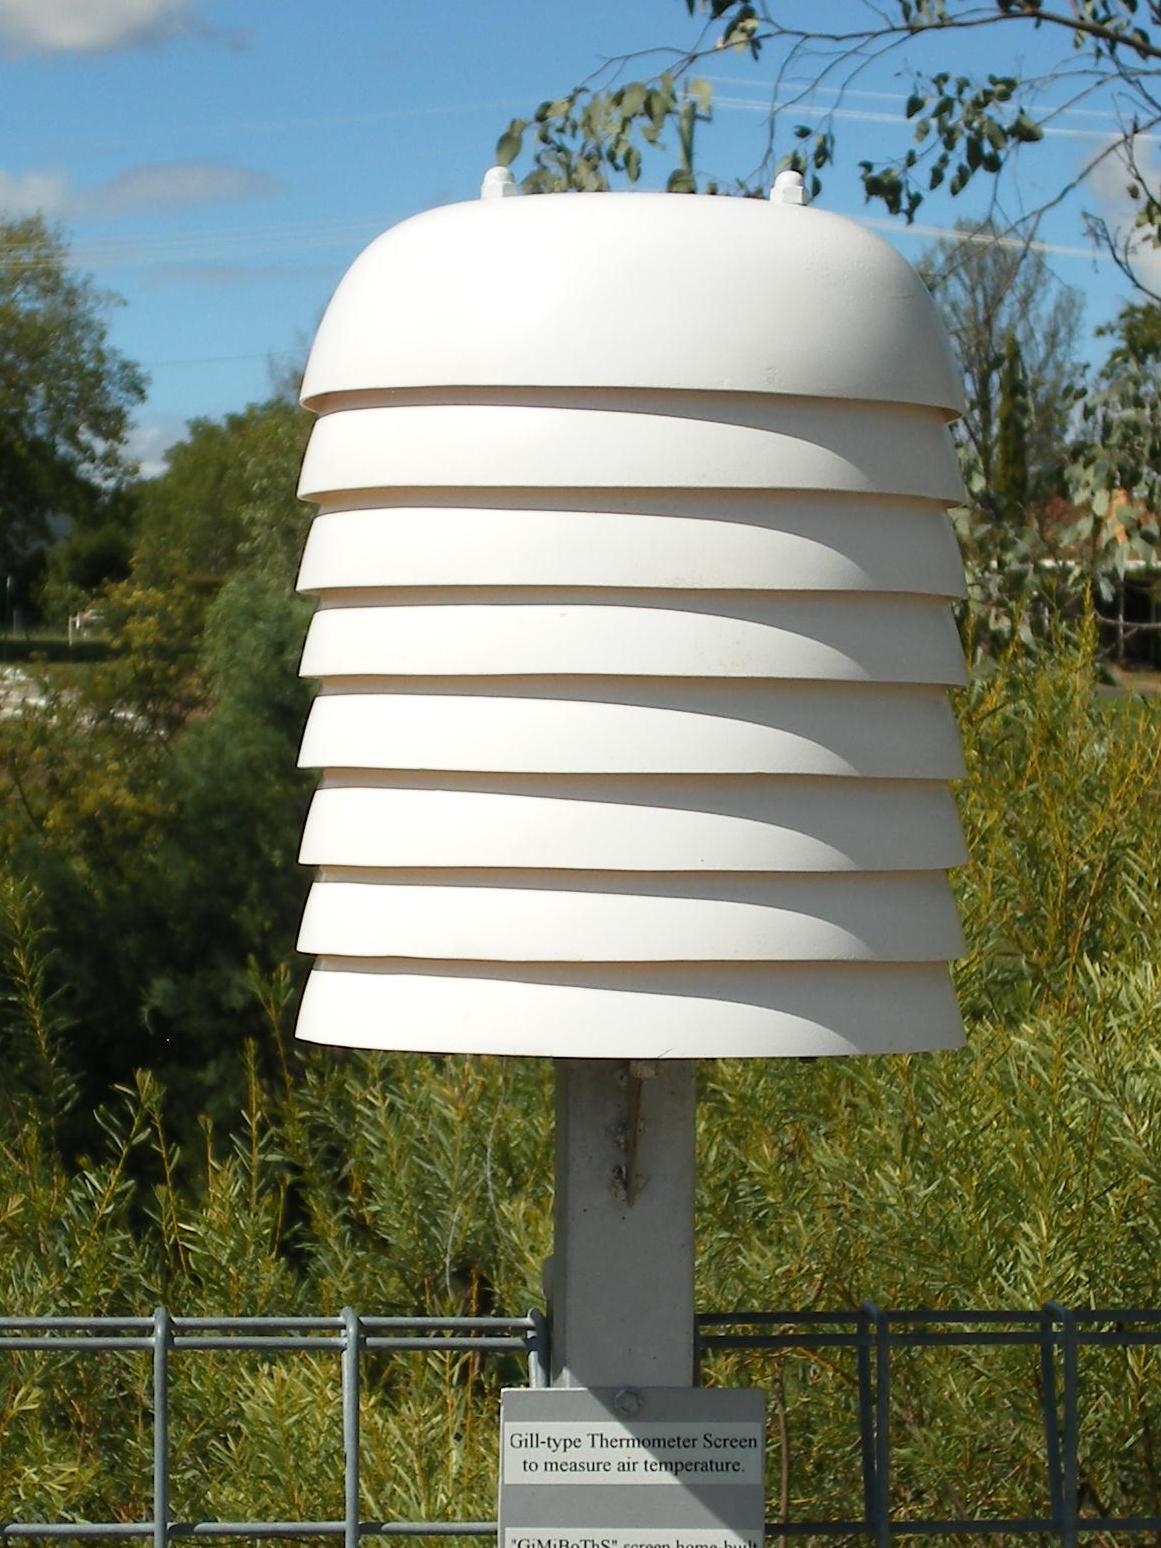
Giant Mixing Bowl Thermometer Screen
I am over the moon at getting agreement between data from my home-made thermometer screen and the best that world climatologists can do. It makes me inclined to believe some of the things they say.
This article and graph were posted on 18th August 2011 in a weatherzone forum: General Weather/ Observations of Climate Variation.


 The graph above is in a more familiar form . It may help to explain what the earlier graph means. That is, that the SOI was dominated by positive values (towards La Niña) for about fifty-nine years before 1976, and was dominated by negative values (towards El Niño) for twenty-four years after that date. From 2000 the trend seems to be upward, showing La Niña dominance again. Broadly, these were straight-line CUSUM relationships throughout each of the periods, as shown by the coloured trend lines. Slopes on a CUSUM plot represent offsets of the mean monthly value: the mean SOI in the earlier period was +1.4 units, and that in the second period was -3.5 units. Since 2000, the mean monthly value is around +1.0 units. Continue reading