A case moth
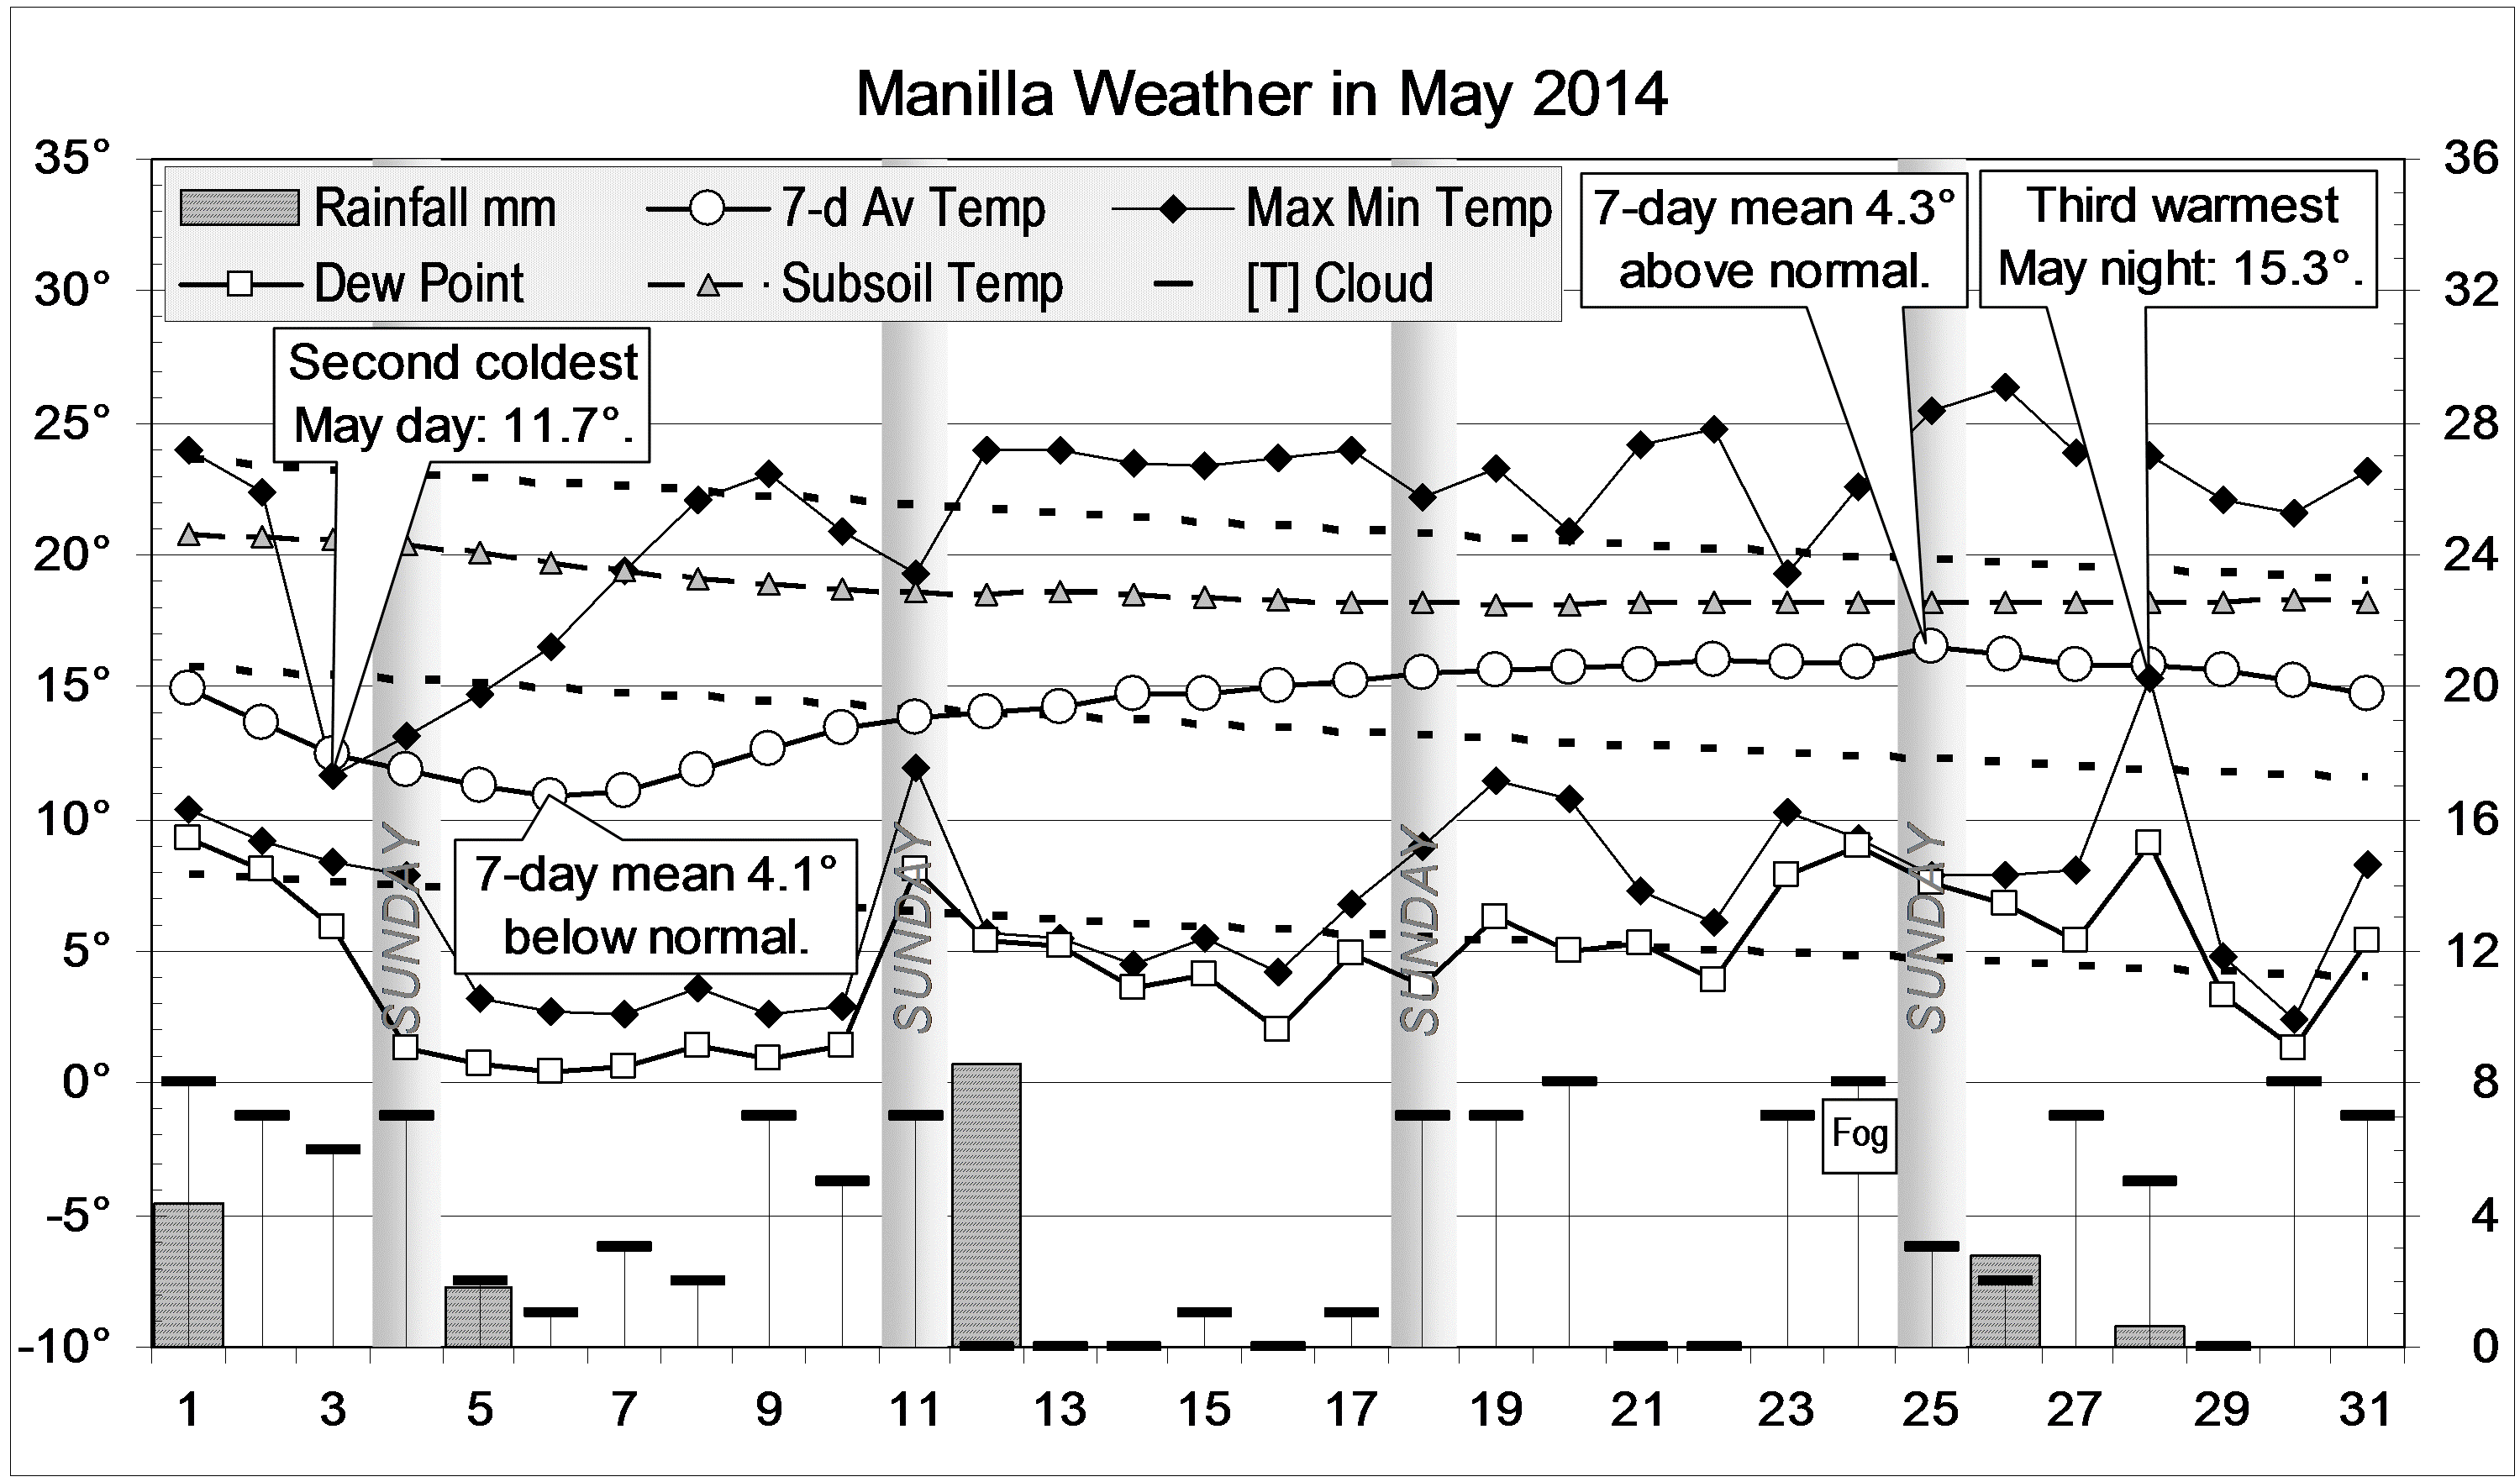
While there were four frosts (usually 6) that came early in the month, a record number of eleven nights were warmer than 10°. Some were very warm. At 15.1°, the night of the 3rd was the 4th warmest May night. Although the night of the 31st was only 13.0°, since it came so late, that was 9.0° above normal for that date. By contrast, most days were cooler than normal.
The frostier times were sunny, but skies later became cloudy. Finally, days were chilly and overcast. Cloud blanketed the hills, but steady rain (16.5 mm) held off until the very end.

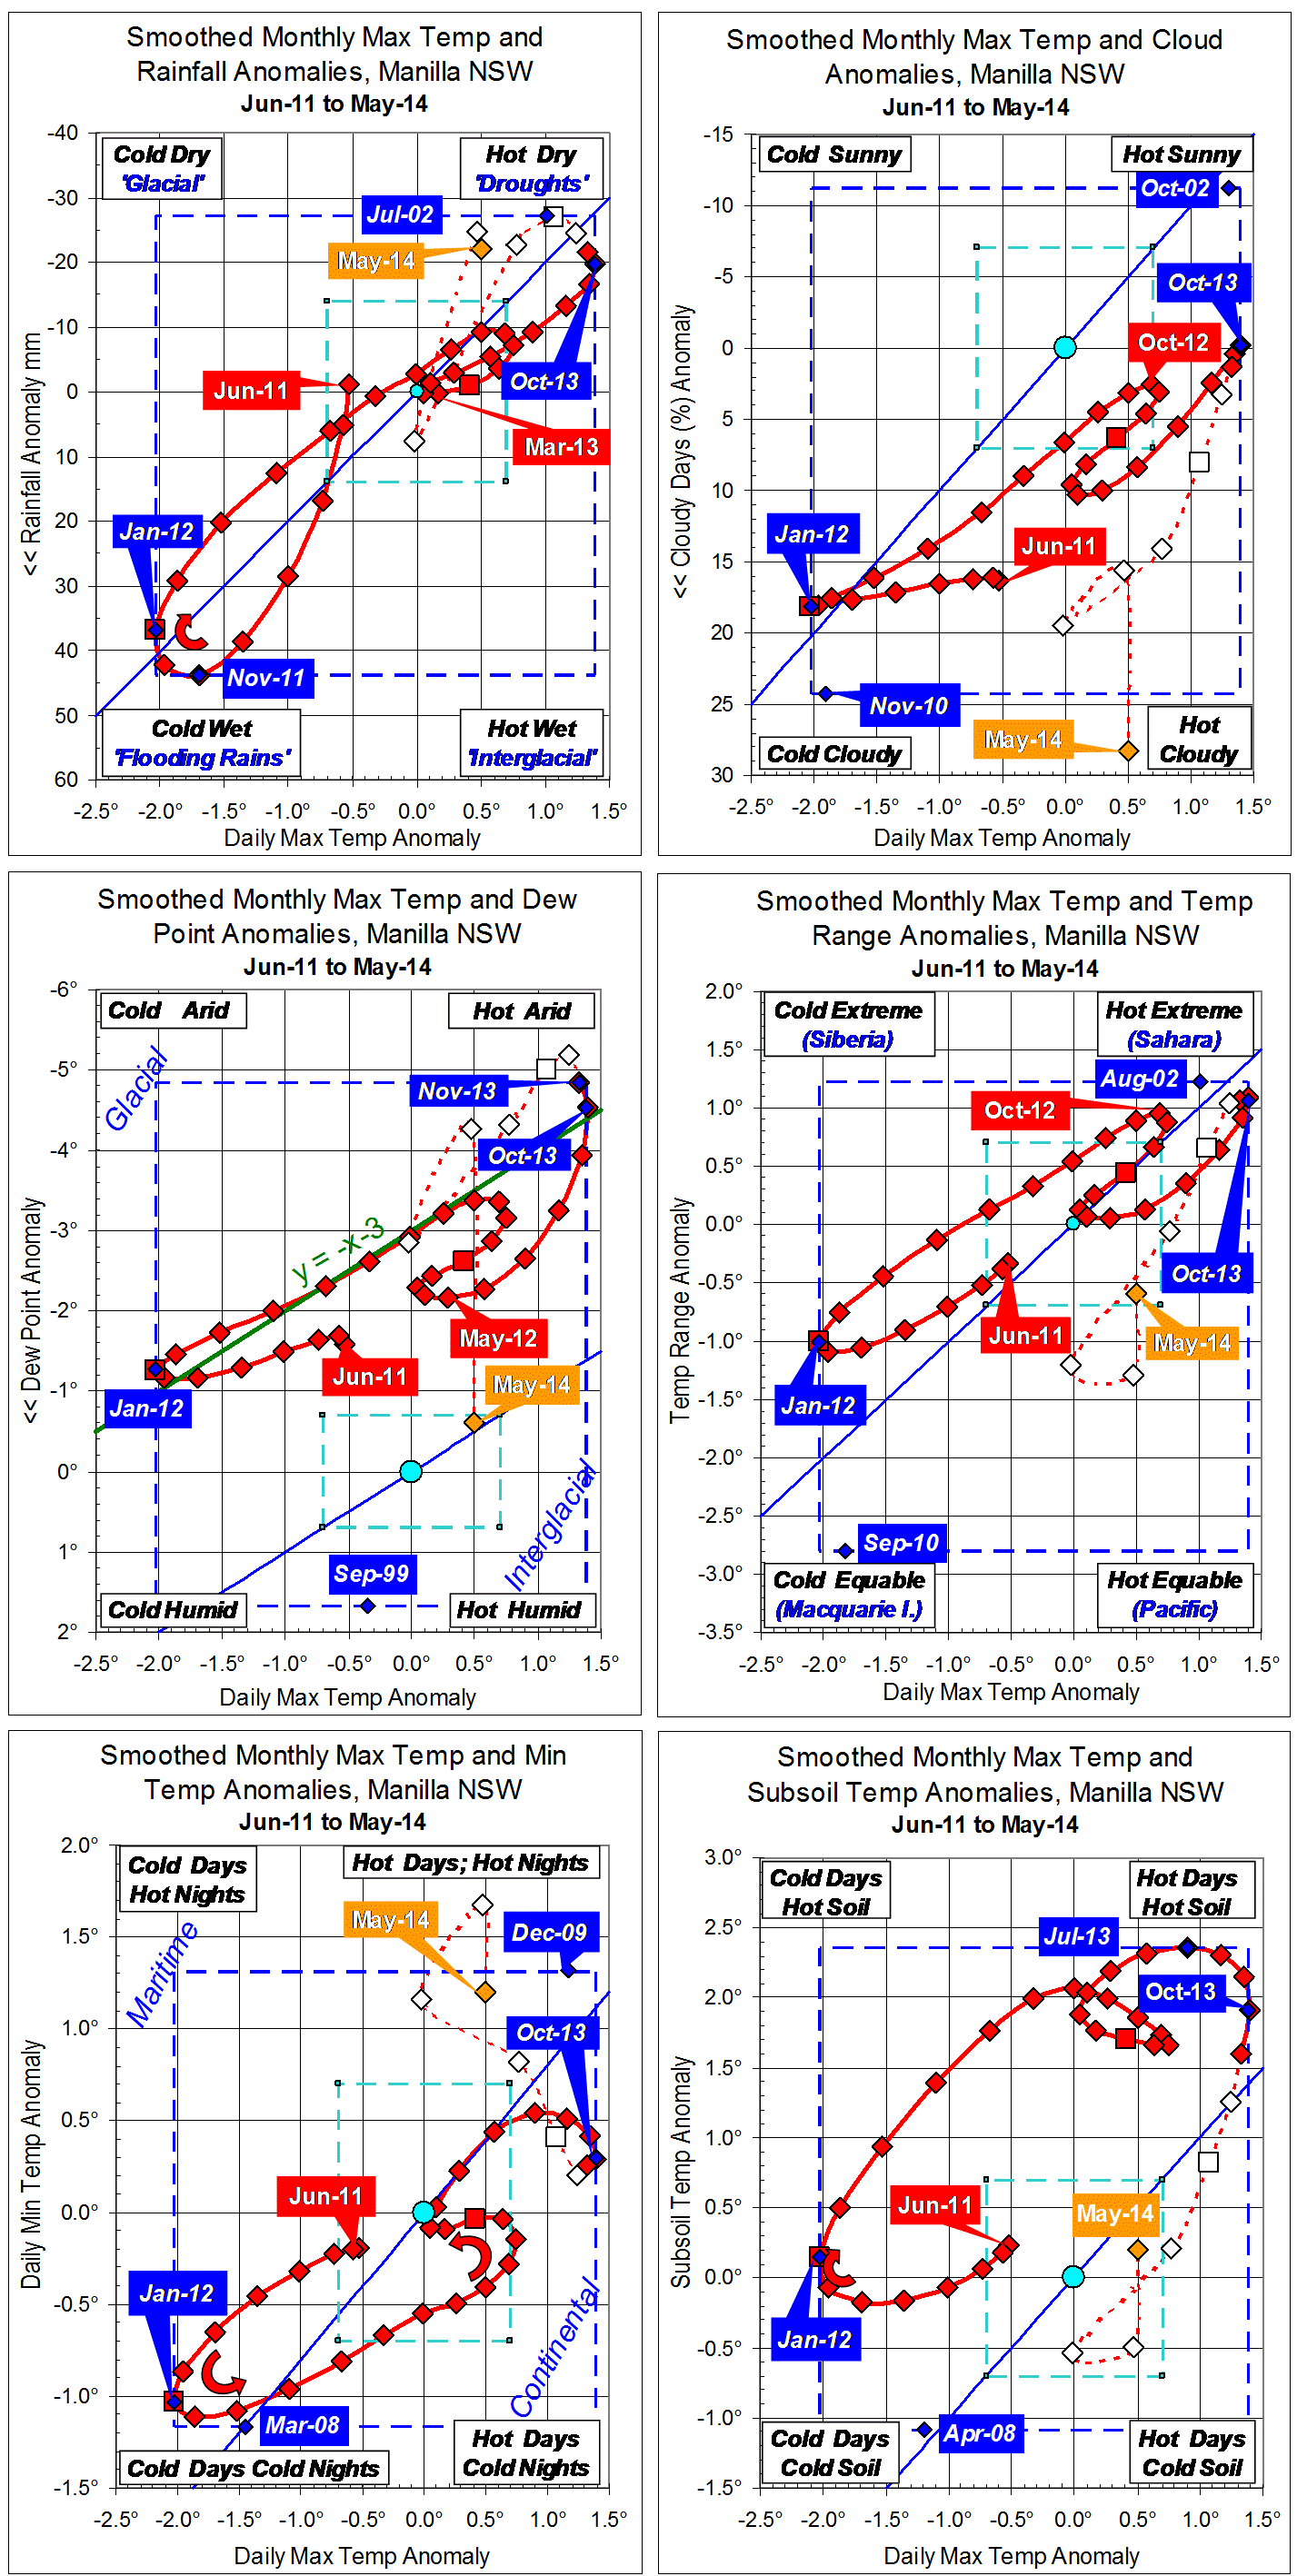
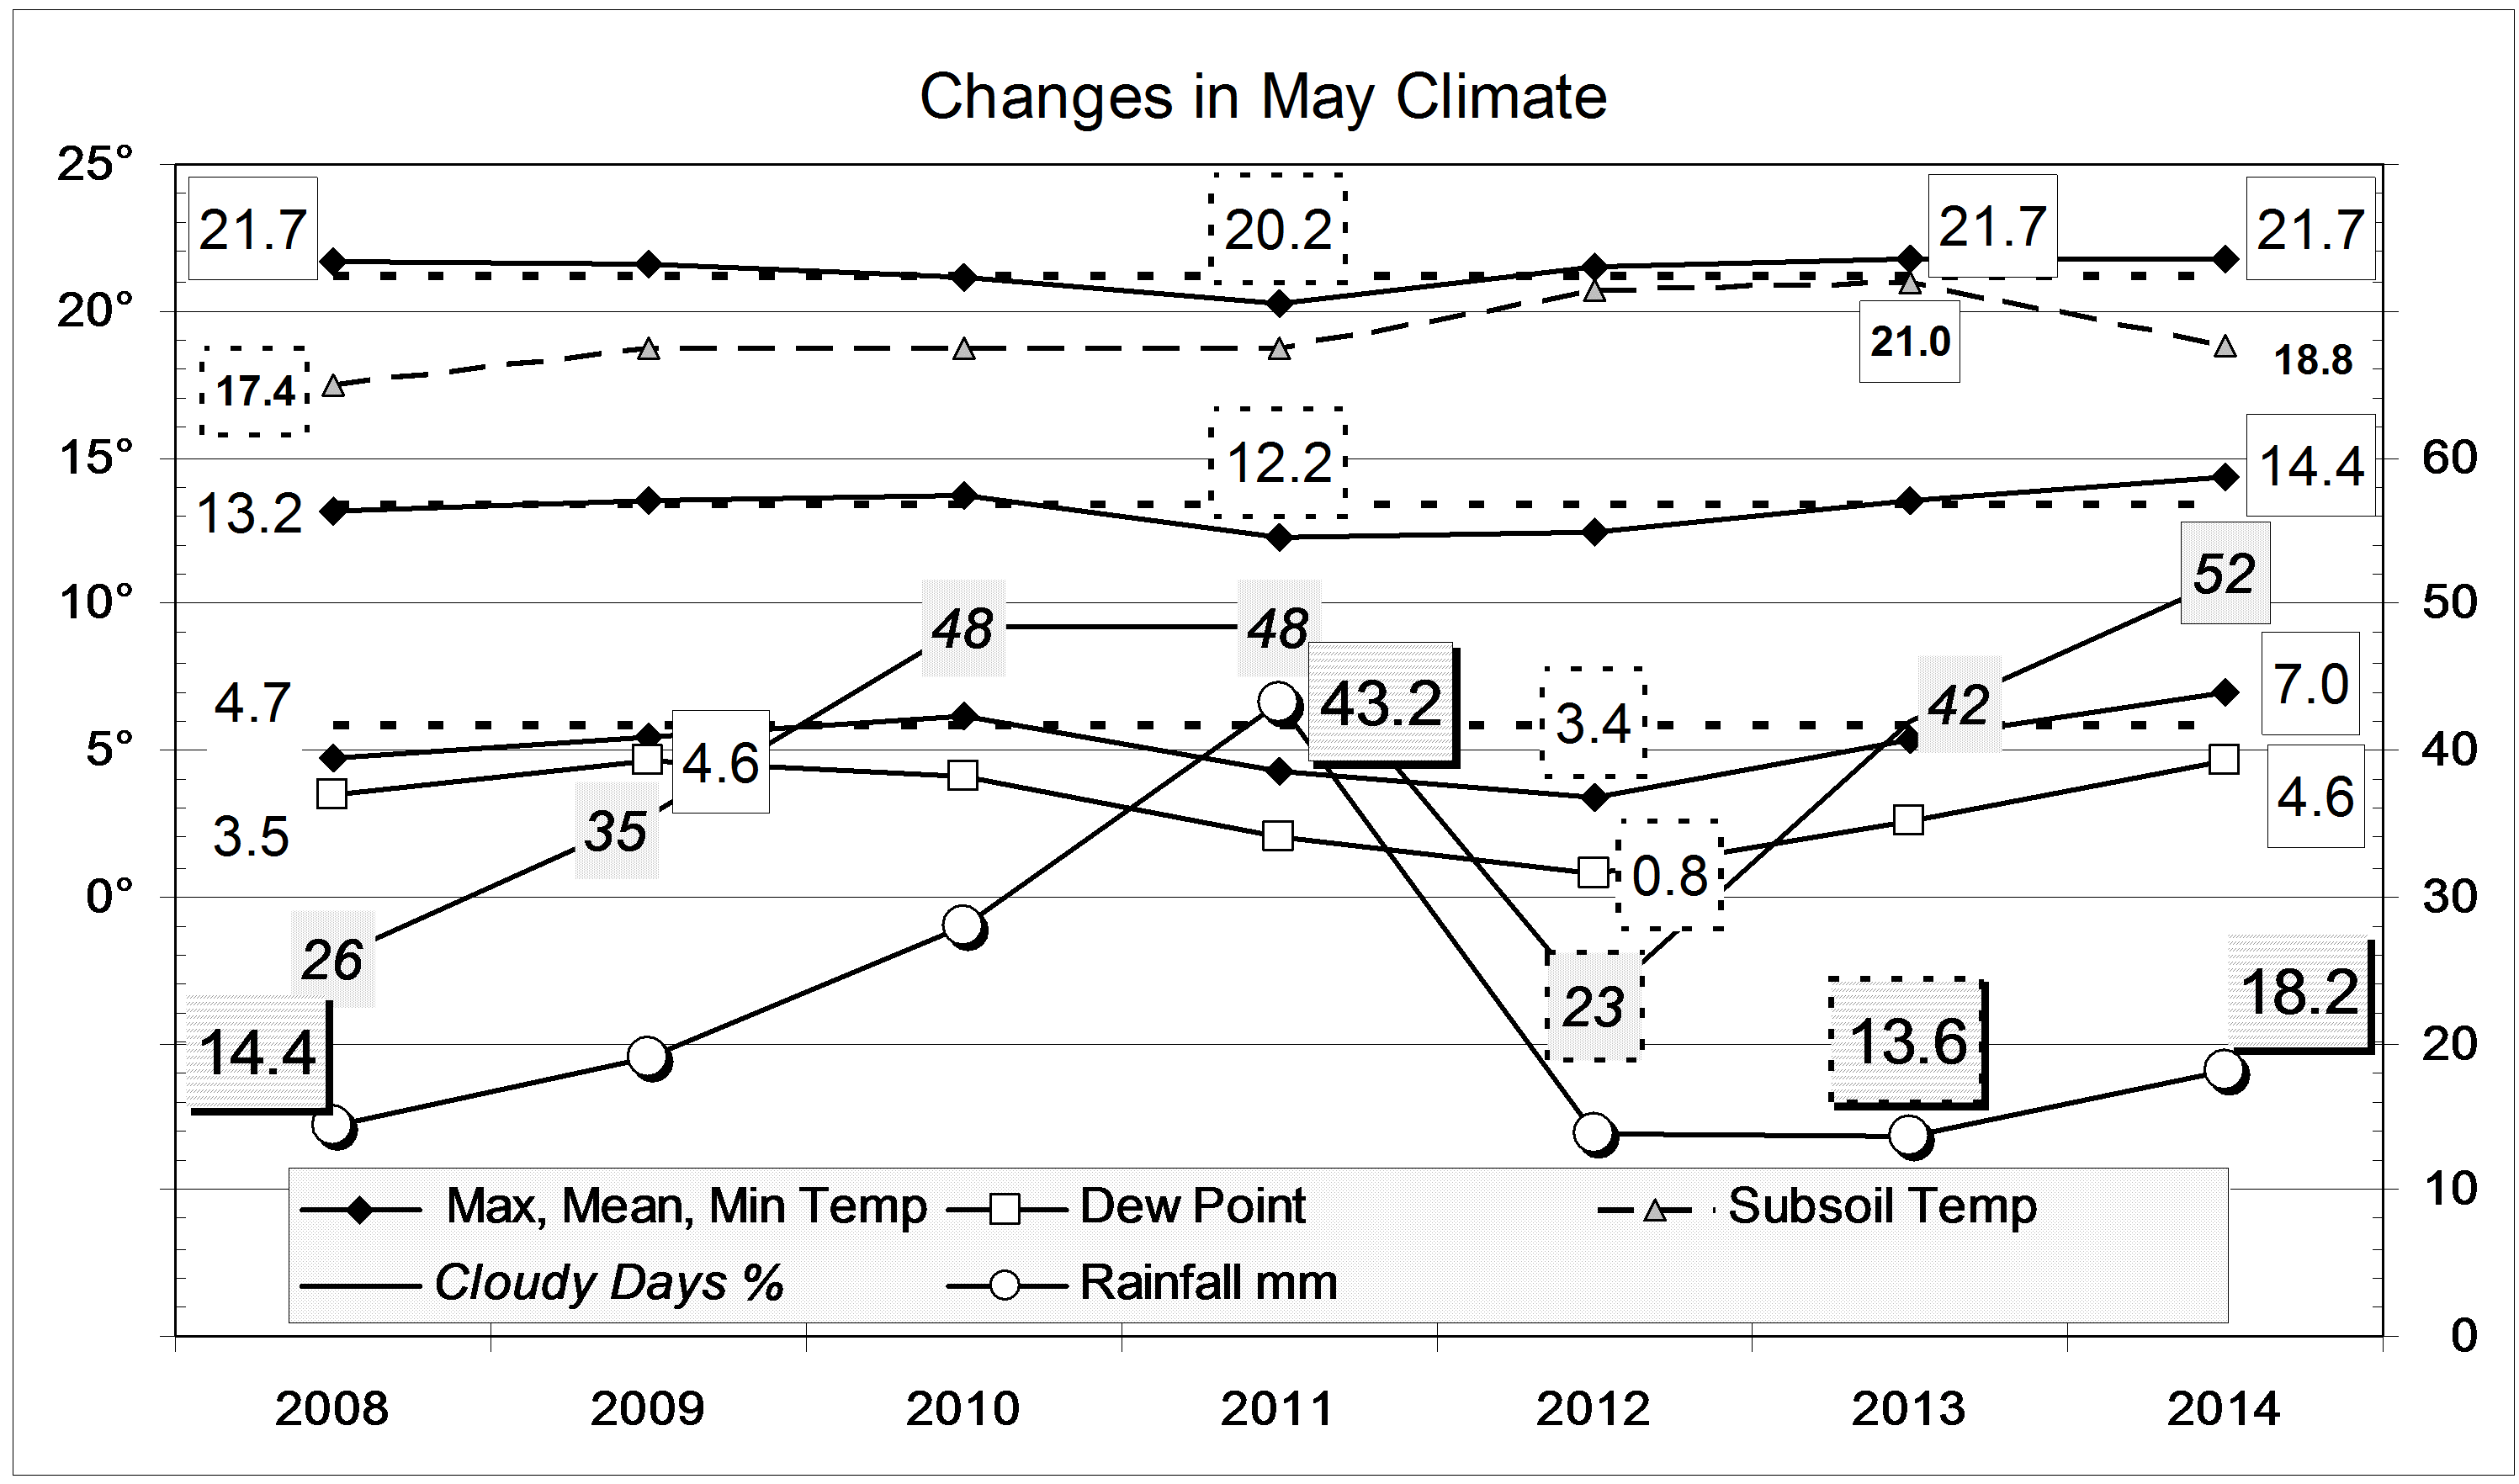
Comparing May months
The most remarkable mean value for the month is the daily temperature range: at 12.9°, it is 2.4° below normal. The May months with the narrowest ranges to date, in 2001 and 2014, had ranges of 14.7°, only 0.6° below normal. The narrow temperature range is due to cloudy skies which, at 52%, equal the record for May.
Linked with these figures are a very cool mean daily maximum temperature of 20.2°, and a very warm mean daily minimum temperature of 7.3°. The mean early morning dew point (5.0°) is not high, but higher than in any May month since 2007.
The total rainfall of 30.8 mm is in the 51st percentile. (While the long-term May average is 40 mm, May rainfall in the 21st century has averaged only 21 mm.) Among rainfall totals for more than one month, there are no serious shortages. The lowest percentile value (14th) is for the 24-month total of 1019 mm.

Data. All data, including subsoil at 750 mm, are from 3 Monash Street, Manilla.