3-year trends to March 2012

Parametric plots of smoothed climate variables at Manilla

“Retreat from cold wet extreme”Trends to March 2012.

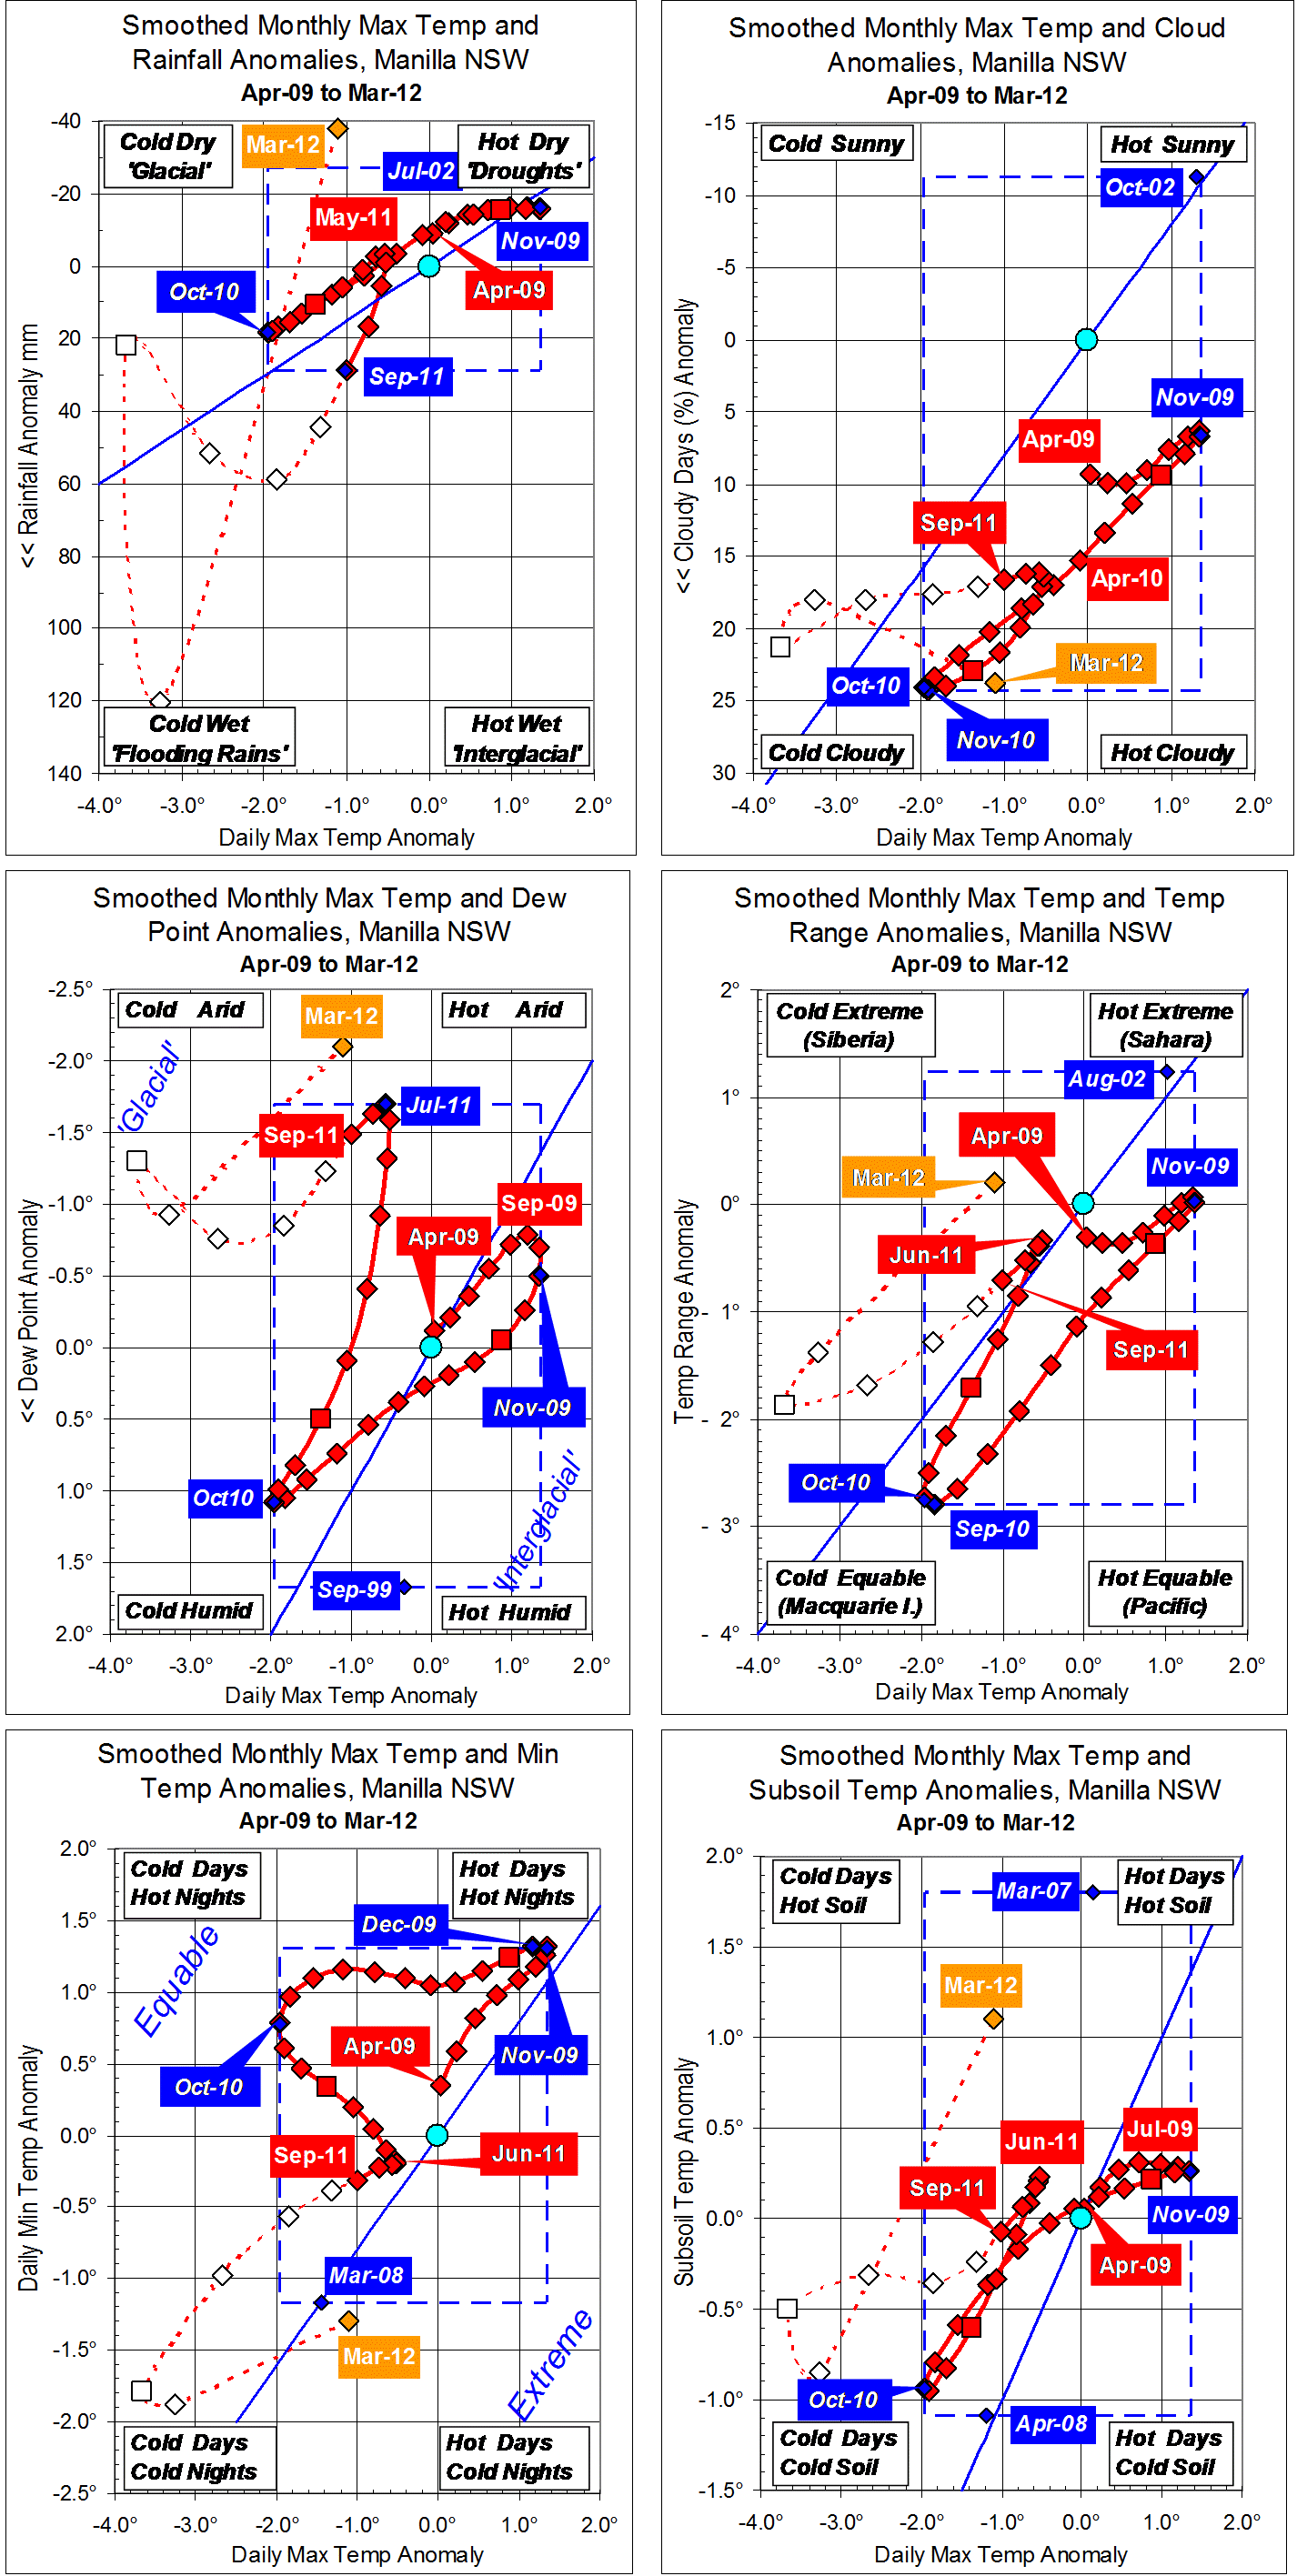
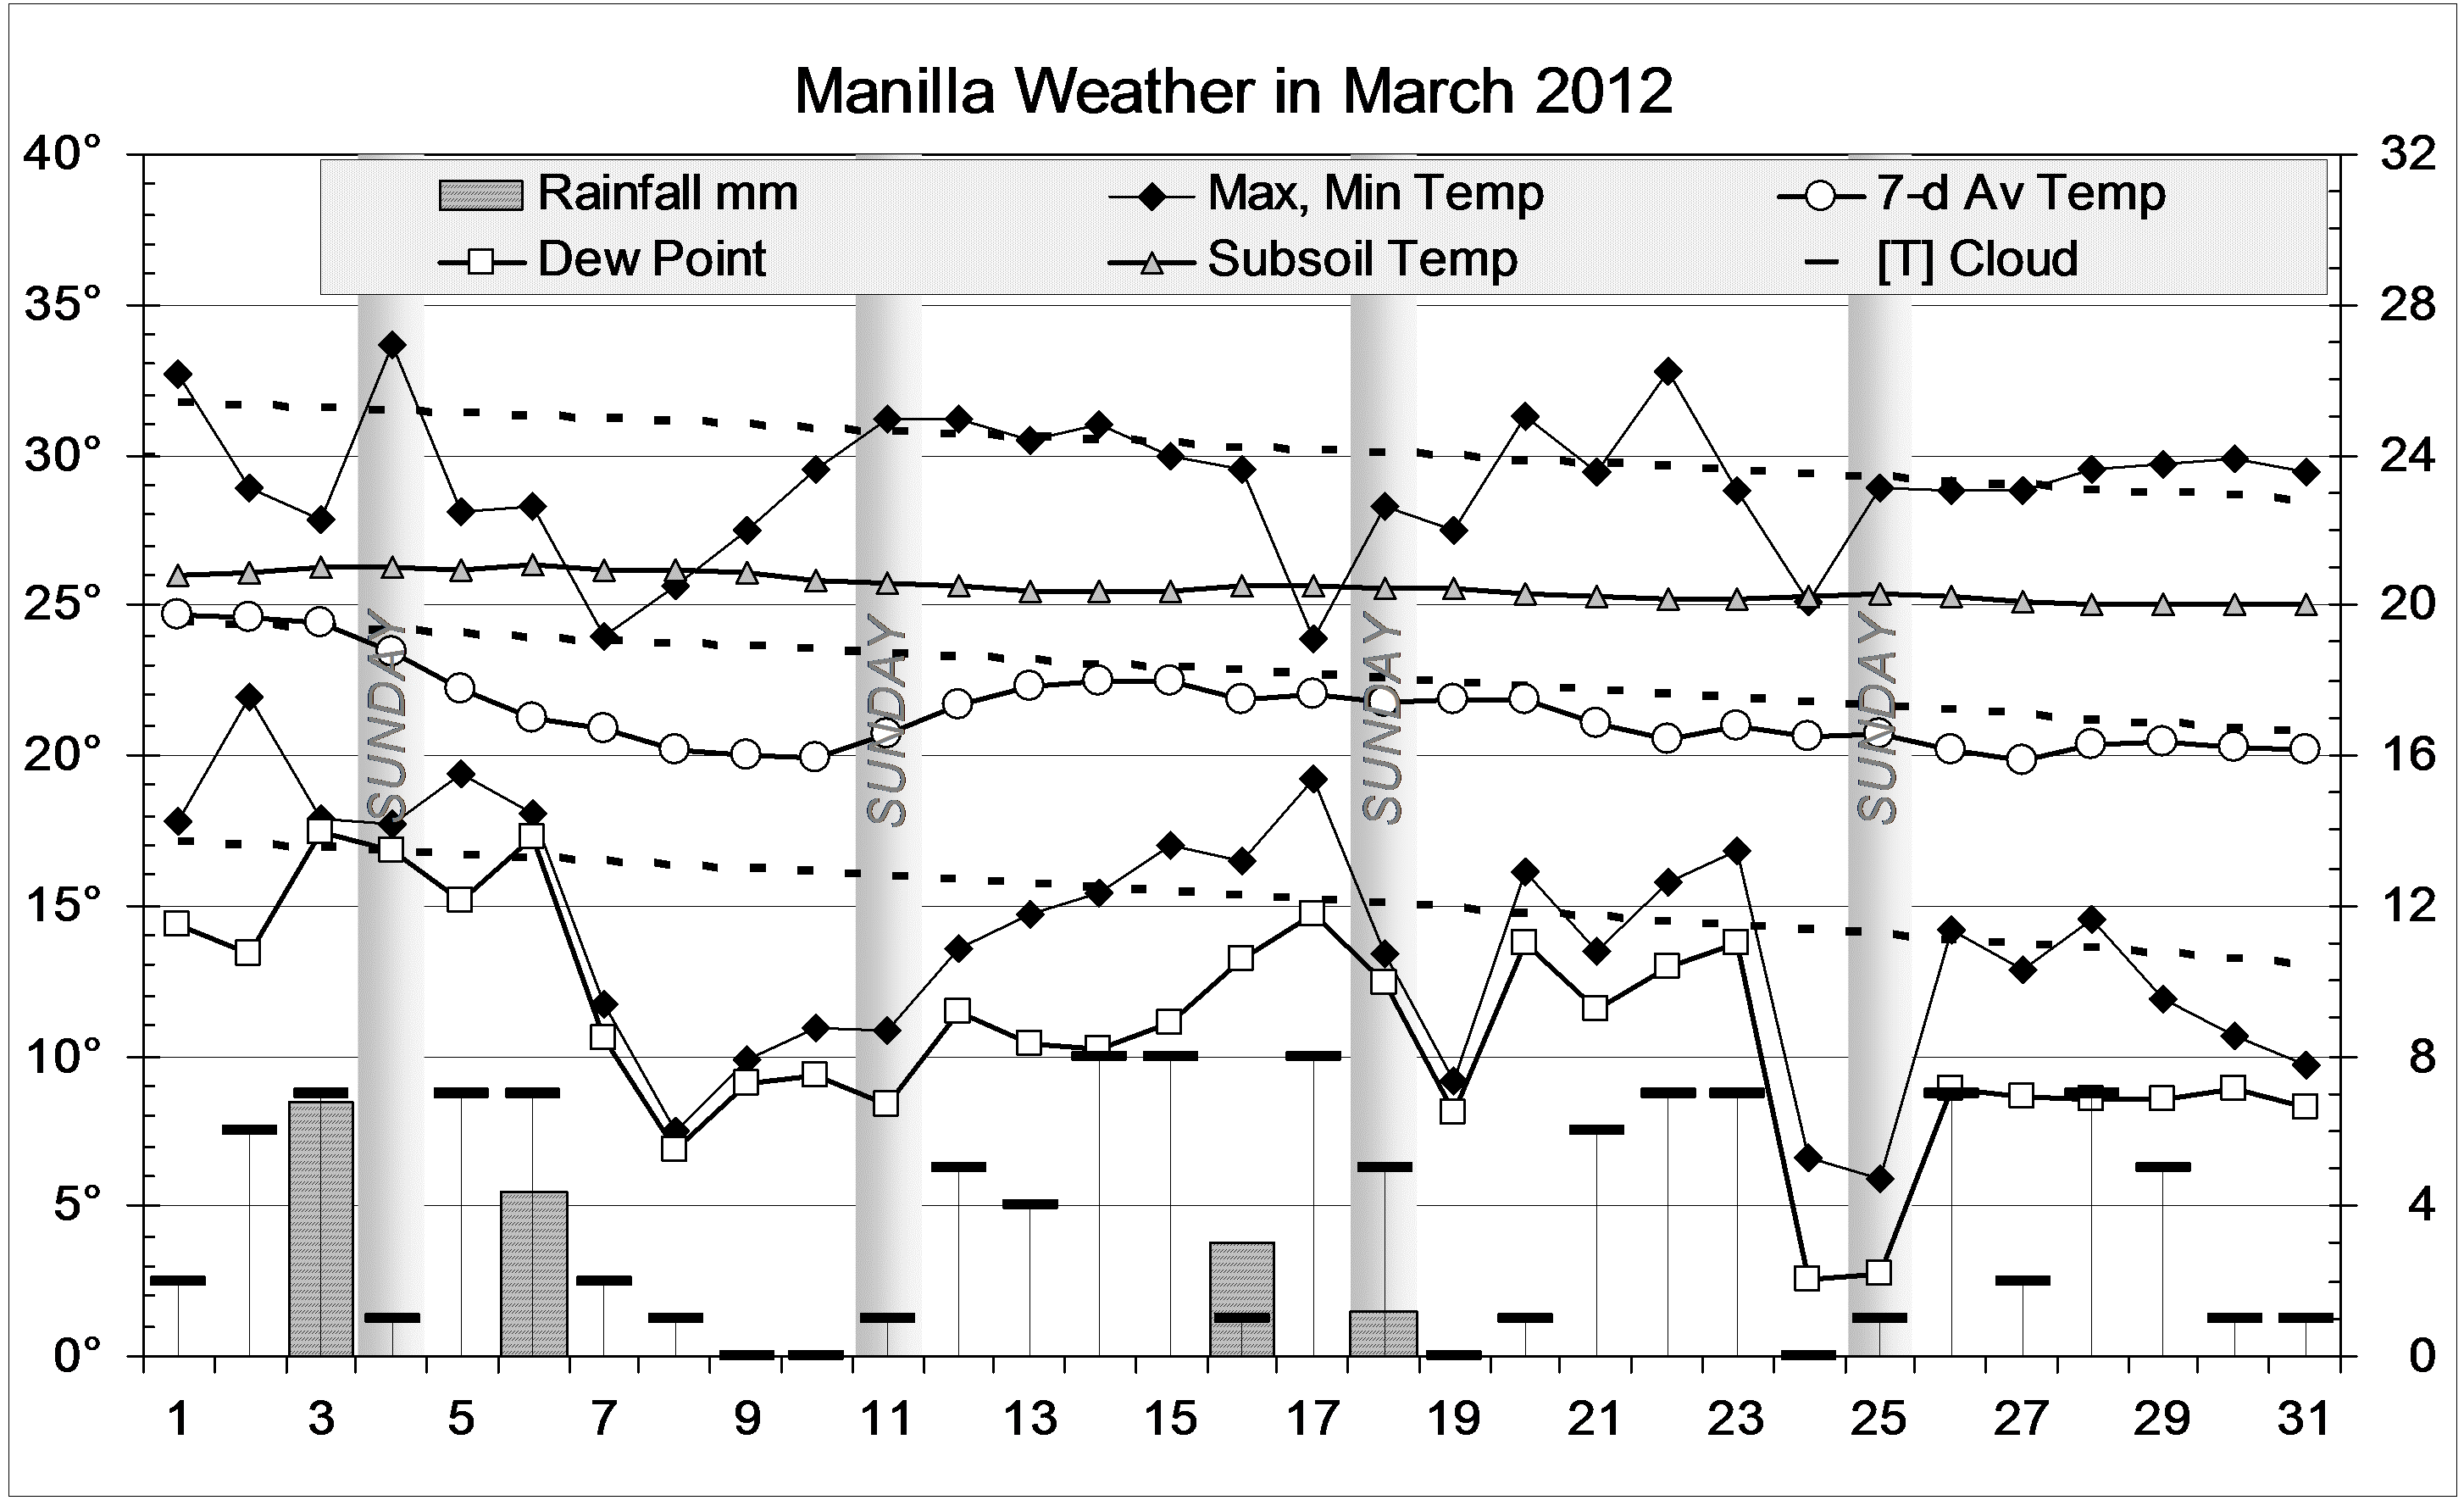
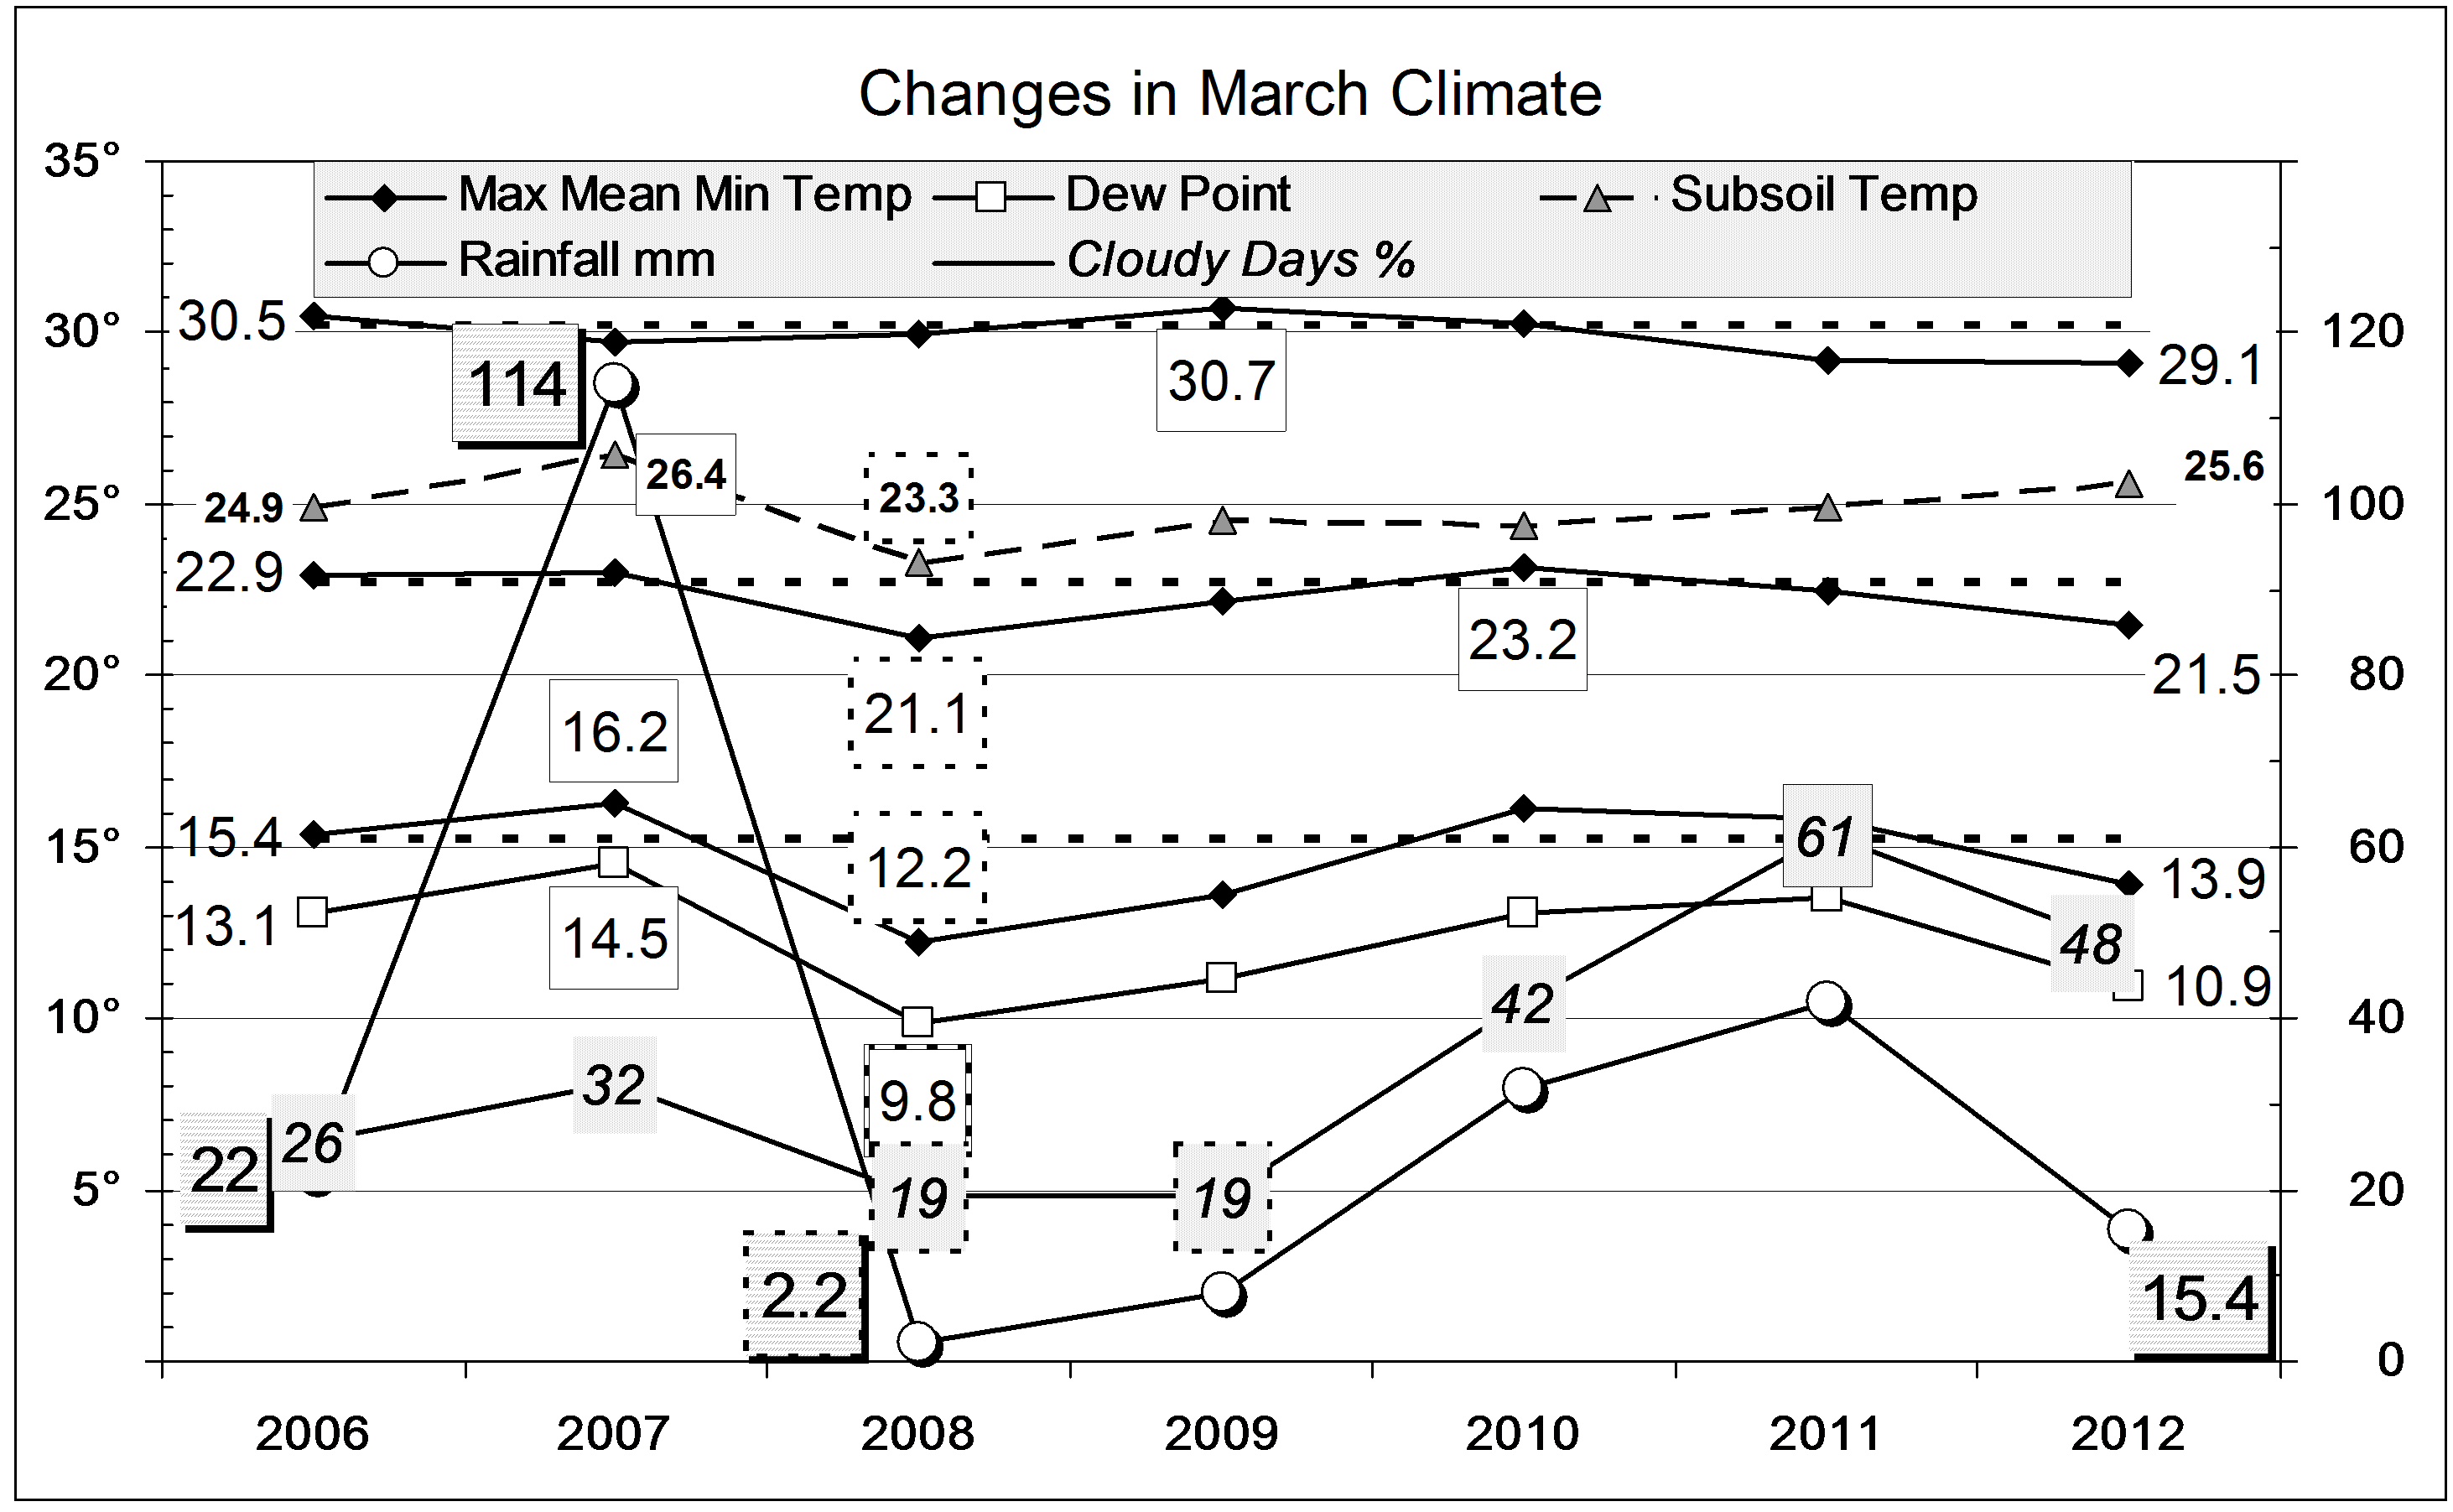
New raw data for March 2012 anomalies show a retreat from low extremes towards normal for maximum and minimum temperatures, and temperature range. Rainfall (perhaps temporarily) moved to negative to positive, and subsoil temperature from negative to positive. Cloudiness remained very high, and Dew Point very low.

Fully-smoothed data points for September 2011 include a new 13-year record high monthly rainfall anomaly of +28.6 mm (first graph). This beats the record of +20.0 mm set in November 2005. The new record is sure to be beaten by October and November 2011 when their values can be smoothed.

Although the smoothed value for maximum temperature anomaly in September 2011 was not very low, the smoothed value for December 2011 may reach a record low.

Note: Fully smoothed data – Gaussian smoothing with half-width 6 months – are plotted in red, partly smoothed data uncoloured, and raw data for the last data point in orange. January data points are marked by squares. Blue diamonds and the dashed blue rectangle show the extreme values in the fully smoothed data record since September 1999.

March 2012 a bit dry and cool

The daily weather logWeather log March 2012

Apart from a cold snap about the 9th, March was just a little cooler than usual. There were four rain days, with a maximum reading less than 7 mm. Late in the month, the weather was showery, but none of that rain fell here.

 Comparing March monthsClimate March 2012.

All the mean temperatures, and the Dew Point, were about a degree low. However, this month was not nearly as cold or as dry as March 2008, which had only 2.2 mm of rain, and barely escaped a frost.
The month was very cloudy, but not as cloudy as last year. The subsoil was very warm.
The rainfall total of 15.4 mm is well below the March average of 53.3 mm. It is in the 26th percentile: about one quarter of all March months have been drier than this one. This rather low reading hardly affects the high totals for groups of months. Totals for periods from five months to twenty-four months are still near record high values. No totals up to the thirty-year total are below normal.


Data. Rainfall data is from Manilla Post Office, courtesy of Phil Pinch. Temperatures, including subsoil at 750 mm, and other data are from 3 Monash Street, Manilla.


3-year trends to March 2011.

Parametric plots of smoothed climate variables at Manilla

“Extreme cloudiness”Trends to March 2011.

Most of the March 2011 raw data values (in orange) are nearer to normal than to recent extremes. As an exception, the March cloudiness anomaly is a record +37%: there were 19 cloudy mornings instead of 8.

Smoothed September values include new 12-year record anomalies for daily maximum temperature (low), cloudy days (high) and daily temperature range (low).

Note: Fully smoothed data – Gaussian smoothing with half-width 6 months – are plotted in red, partly smoothed data uncoloured, and raw data for the last data point in orange. January data points are marked by squares. Blue diamonds and the dashed blue rectangle show the extreme values in the fully smoothed data record since September 1999.

March 2011 still cloudy

The daily weather logWeather log March 2011.

There were two warm spells and two cool spells in March, with no extreme temperatures.
Many mornings were very cloudy: fourteen had 7/8 or 8/8 cloud. In twelve years only six months have had so many. (Last December had sixteen.)
The highest rainfall reading was 17.4 mm on the 18th. In ten rain-days (twice the usual number) the total was 42.0 mm. No rain fell after the 20th.

 Comparing March monthsClimate March 2011.

The mean maximum temperature was a little low and the mean minimum temperature high, making the daily temperature range nearly two degrees narrower than average. Related to this, cloudy mornings (>4/8 cloud) reached a record 61%, equal with June 2010 .
The rainfall of 42 mm is in the 54th percentile for March. While below the long-term average (53 mm), it is far above the most common March total of 11 mm. Rainfall totals for groups of months remain high: above the 70th percentile for all periods up to 15 months.


Data. Rainfall data is from Manilla Post Office, courtesy of Phil Pinch. Temperatures, including subsoil at 750 mm, and other data are from 3 Monash Street, Manilla.


Late March 2010 Warmth

The daily weather logWeather log March 2010

After three early rain days, there was a long spell of warm sunny weather. From the middle of the month, all temperatures rose well above normal. The maximum on the 20th went to 35.7° and the minimum on the 28th to 20.6°. A rain-band in the district in the last days yielded only 8 mm, bringing the month’s total to 31.8 mm in four rain days.

 Comparing March monthsClimate March 2010

While the average maximum and Dew Point readings were near normal, the mean and minimum readings were very high. There were more cloudy mornings than any March in the 11-year record, and the daily temperature range (14.1°) was narrow – not much wider than the 13.5° recorded in March 2007. This month was very like that one, but the rain then was four times as heavy.
The rainfall of 31.8 mm is in the 43rd percentile for March, below the long-term average of 51 mm. There are no serious shortages in rainfalls for groups of months. The worst are the 12-month total of 480 mm (16th percentile) and the nine-year total of 5388mm (12th percentile), which is just under 600 mm/year. (The 125-year average is 652 mm/year, and the median (50th percentile) is 627 mm/year.)


Data. Rainfall data is from Manilla Post Office, courtesy of Phil Pinch. Temperature and other data are from 3 Monash Street, Manilla.