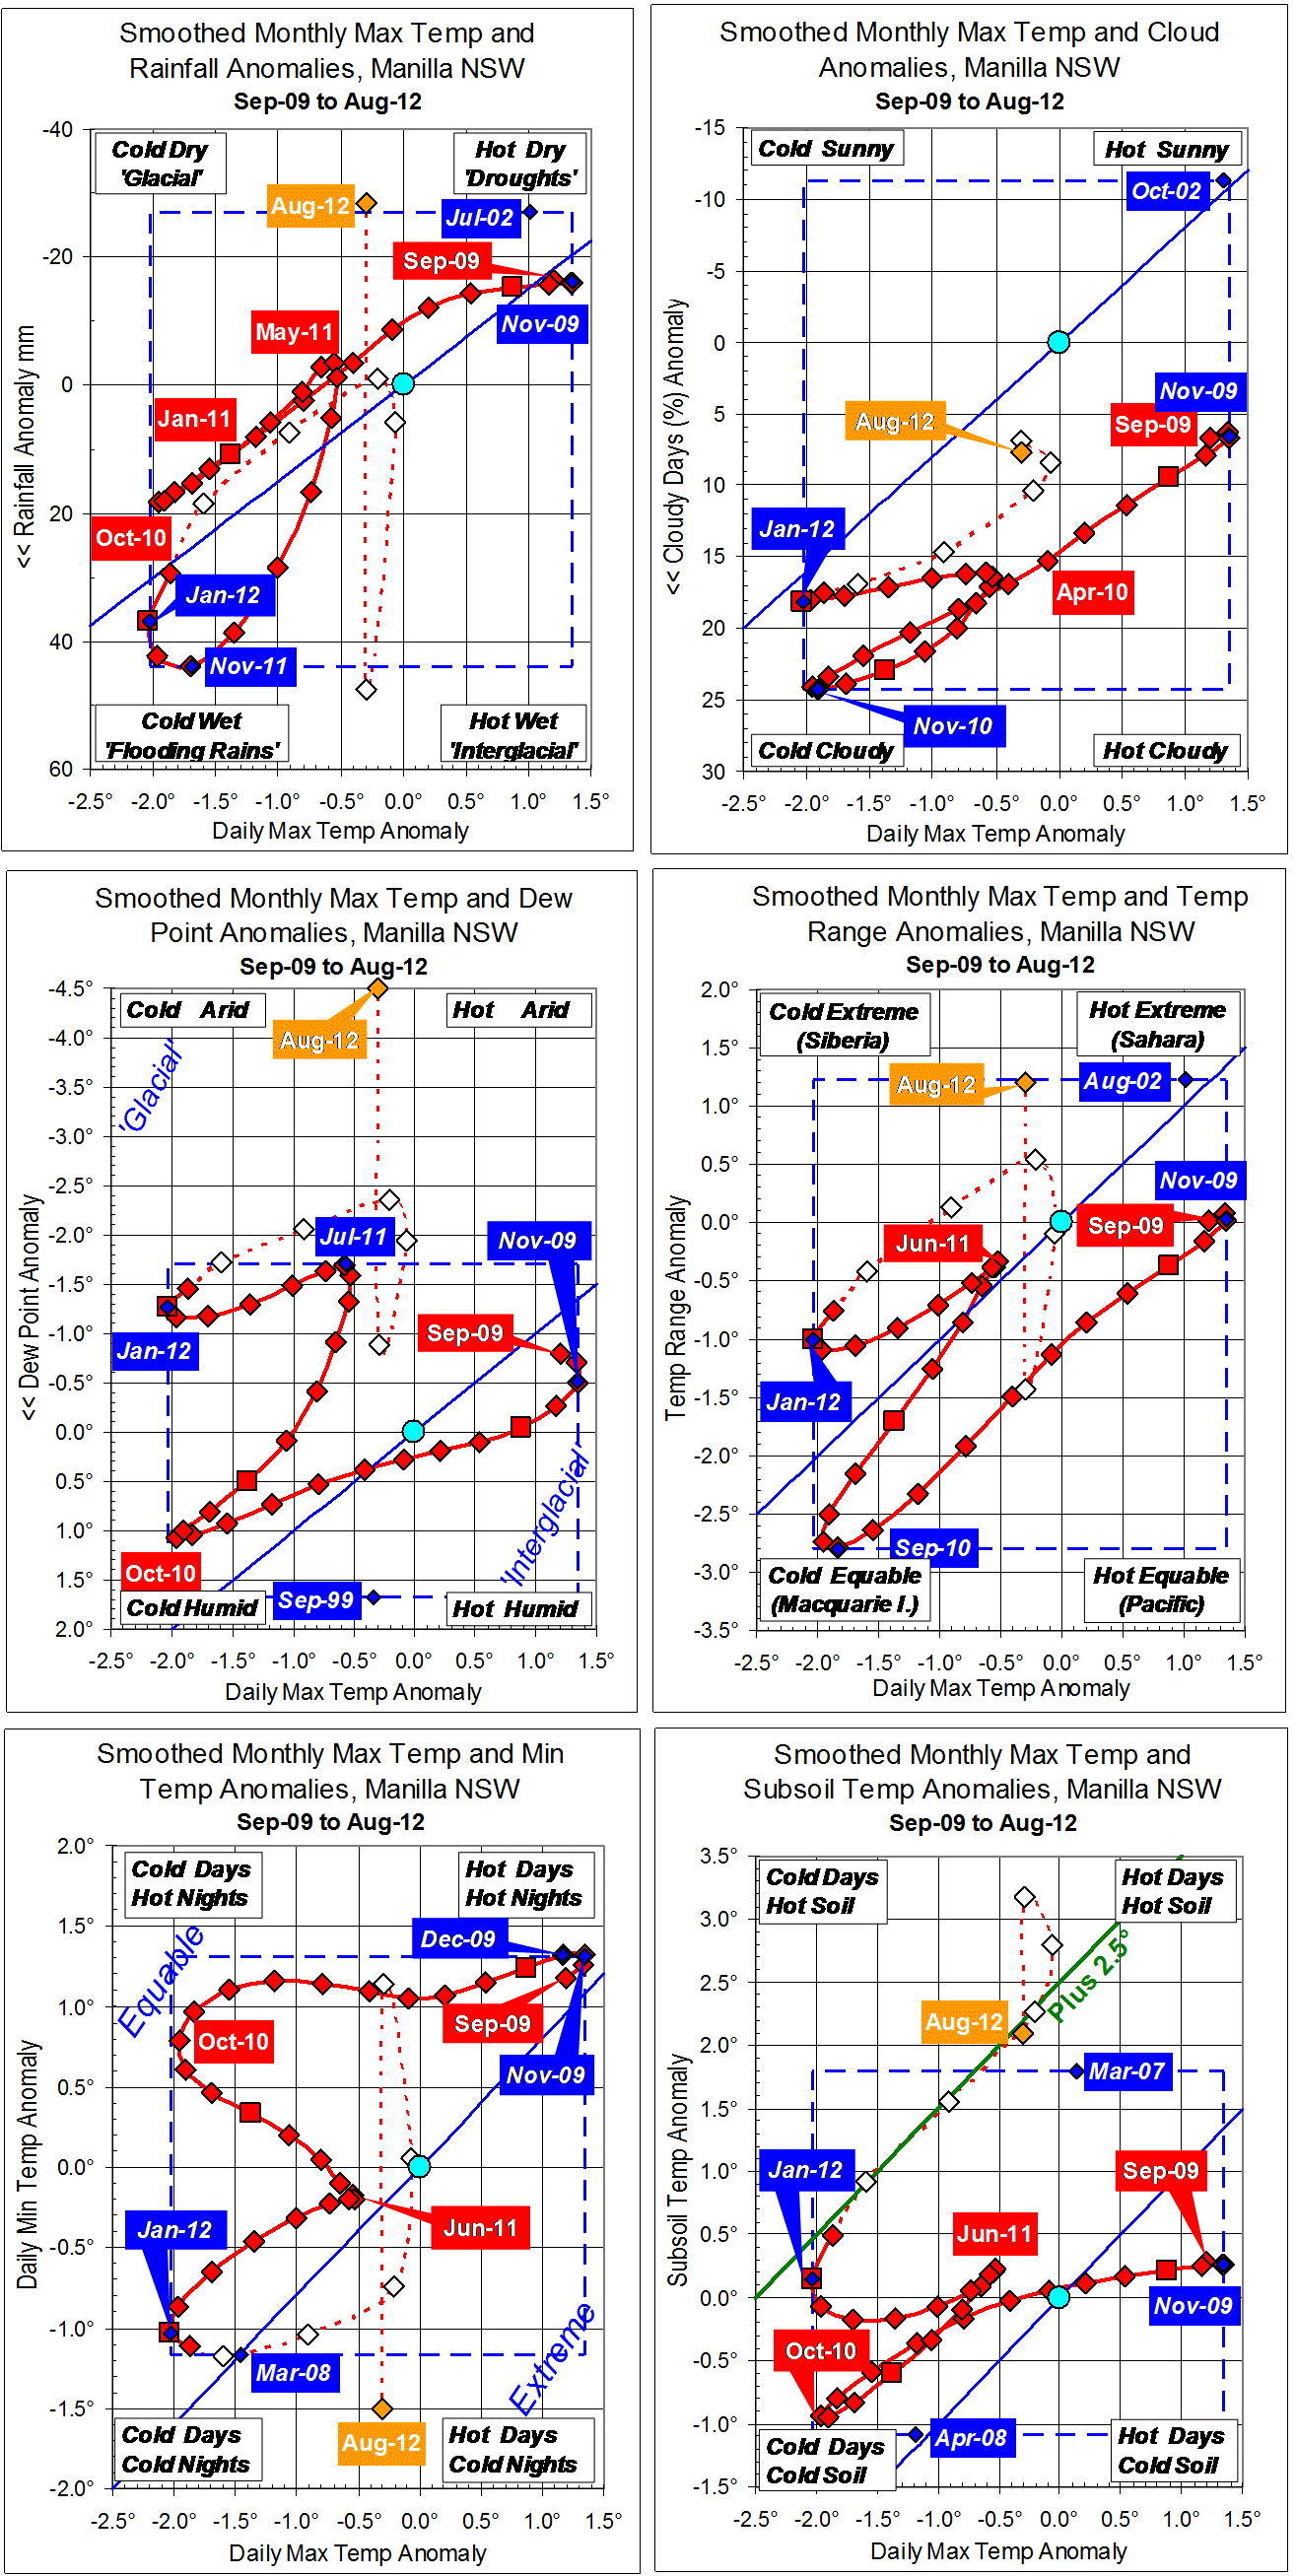
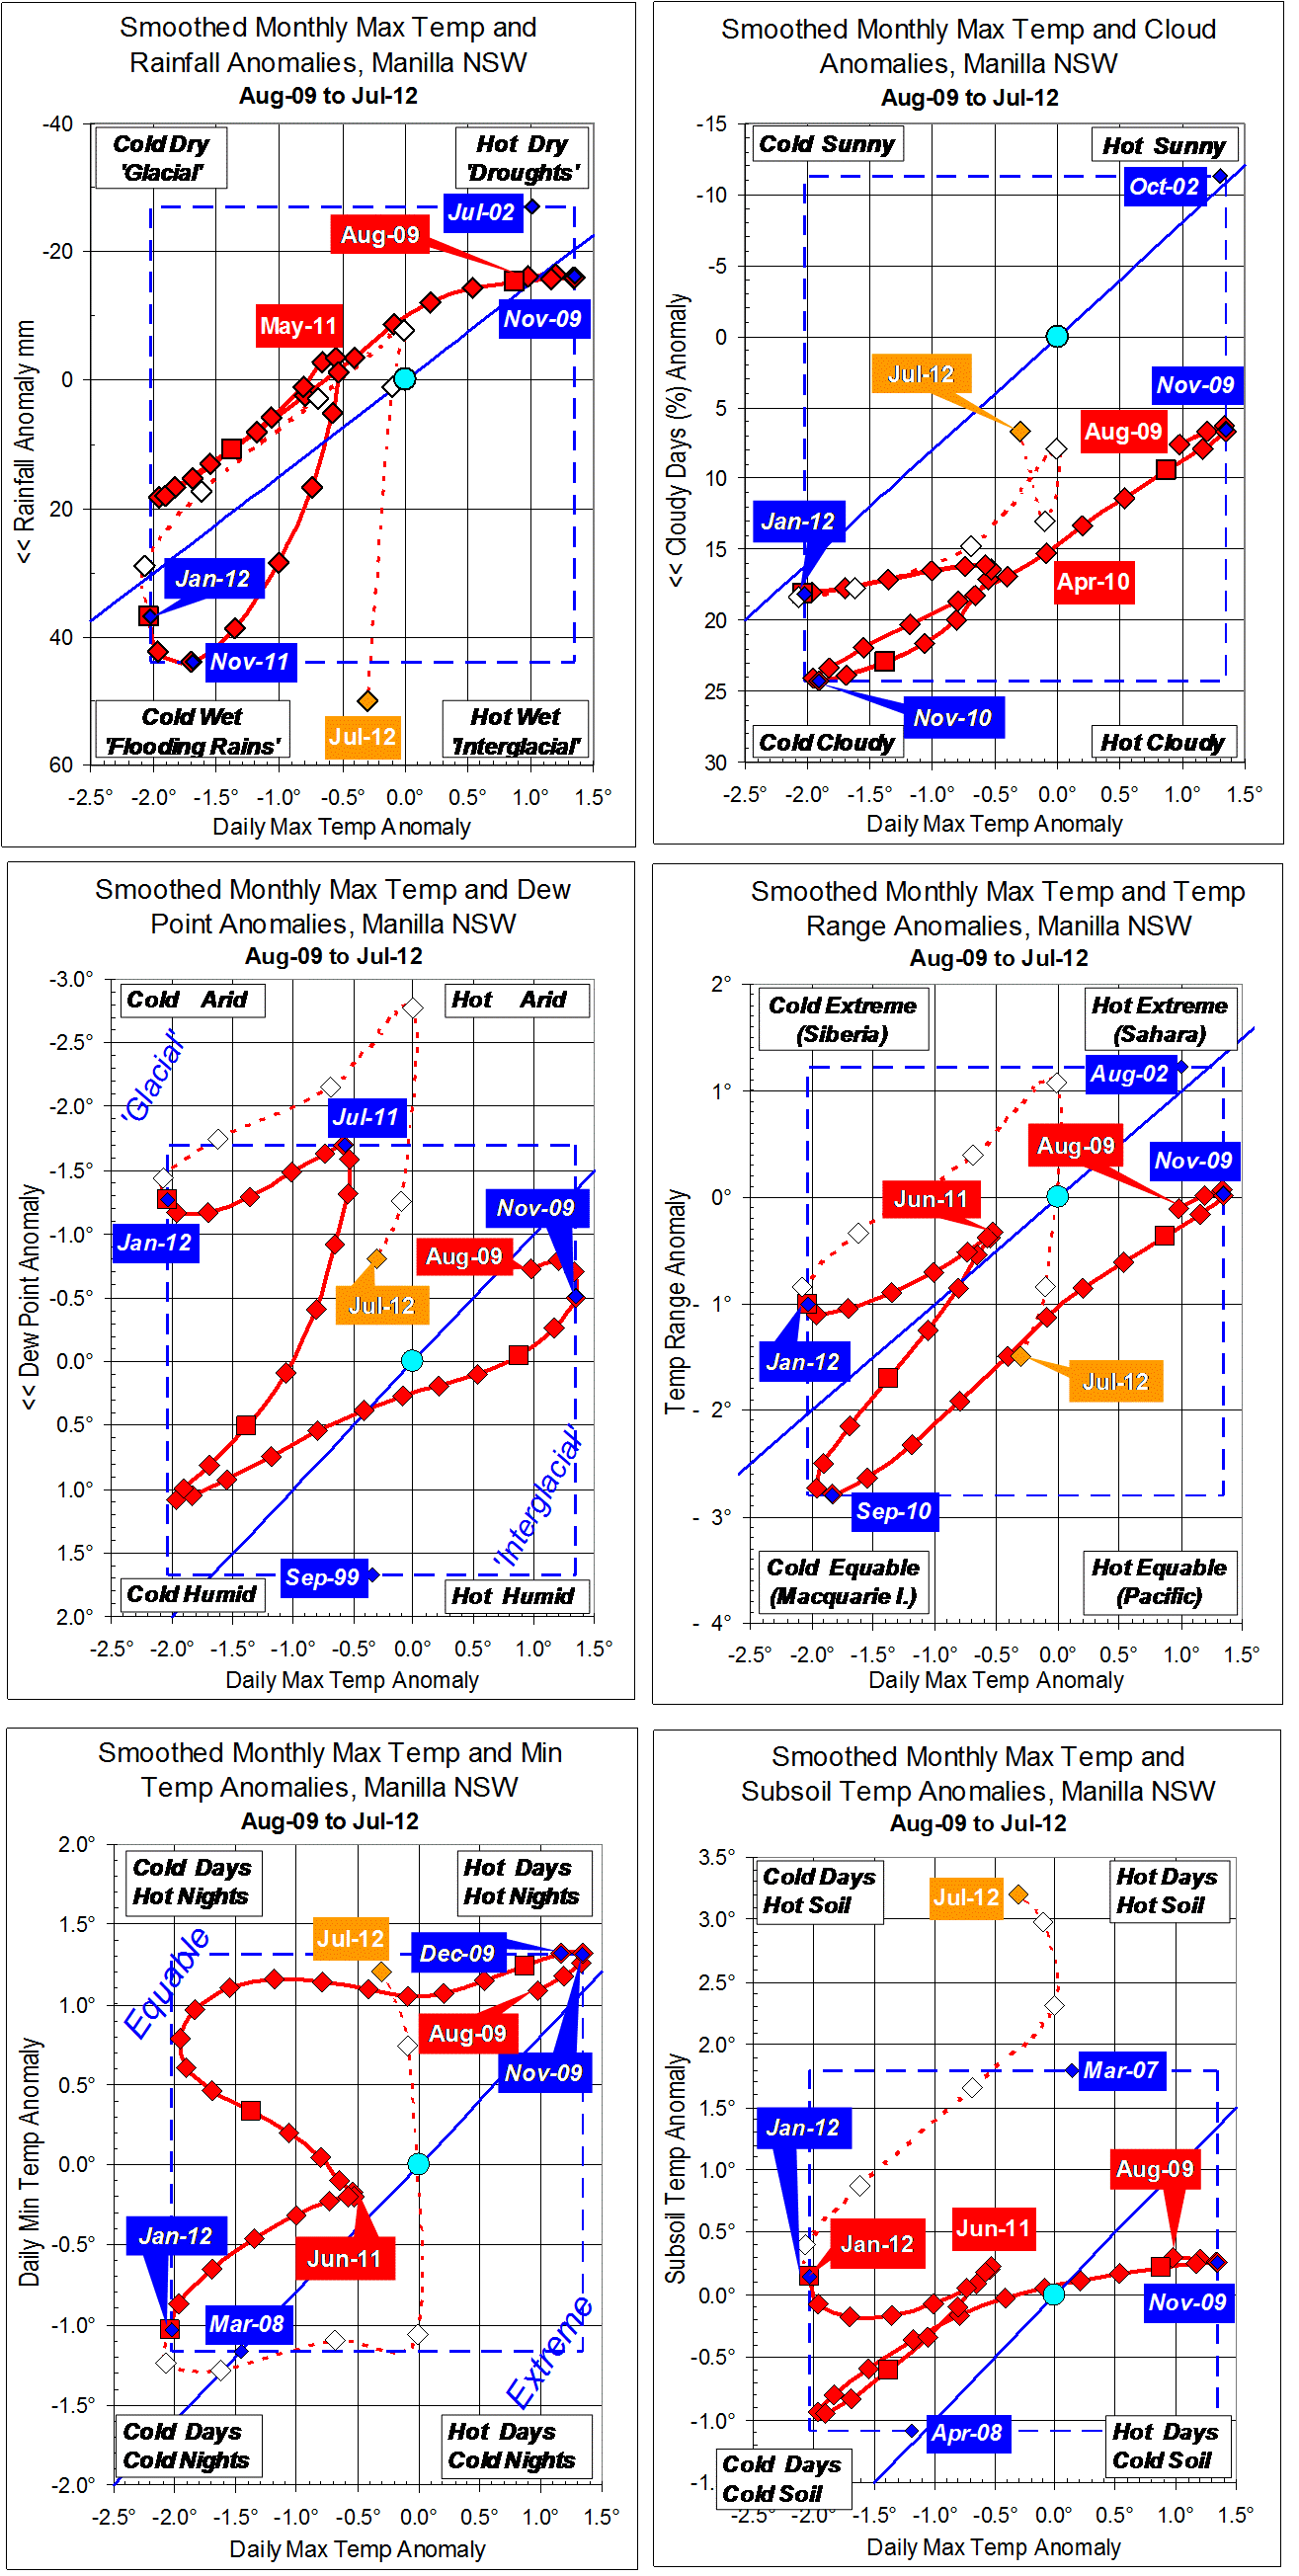
Parametric plots of smoothed climate variables at Manilla
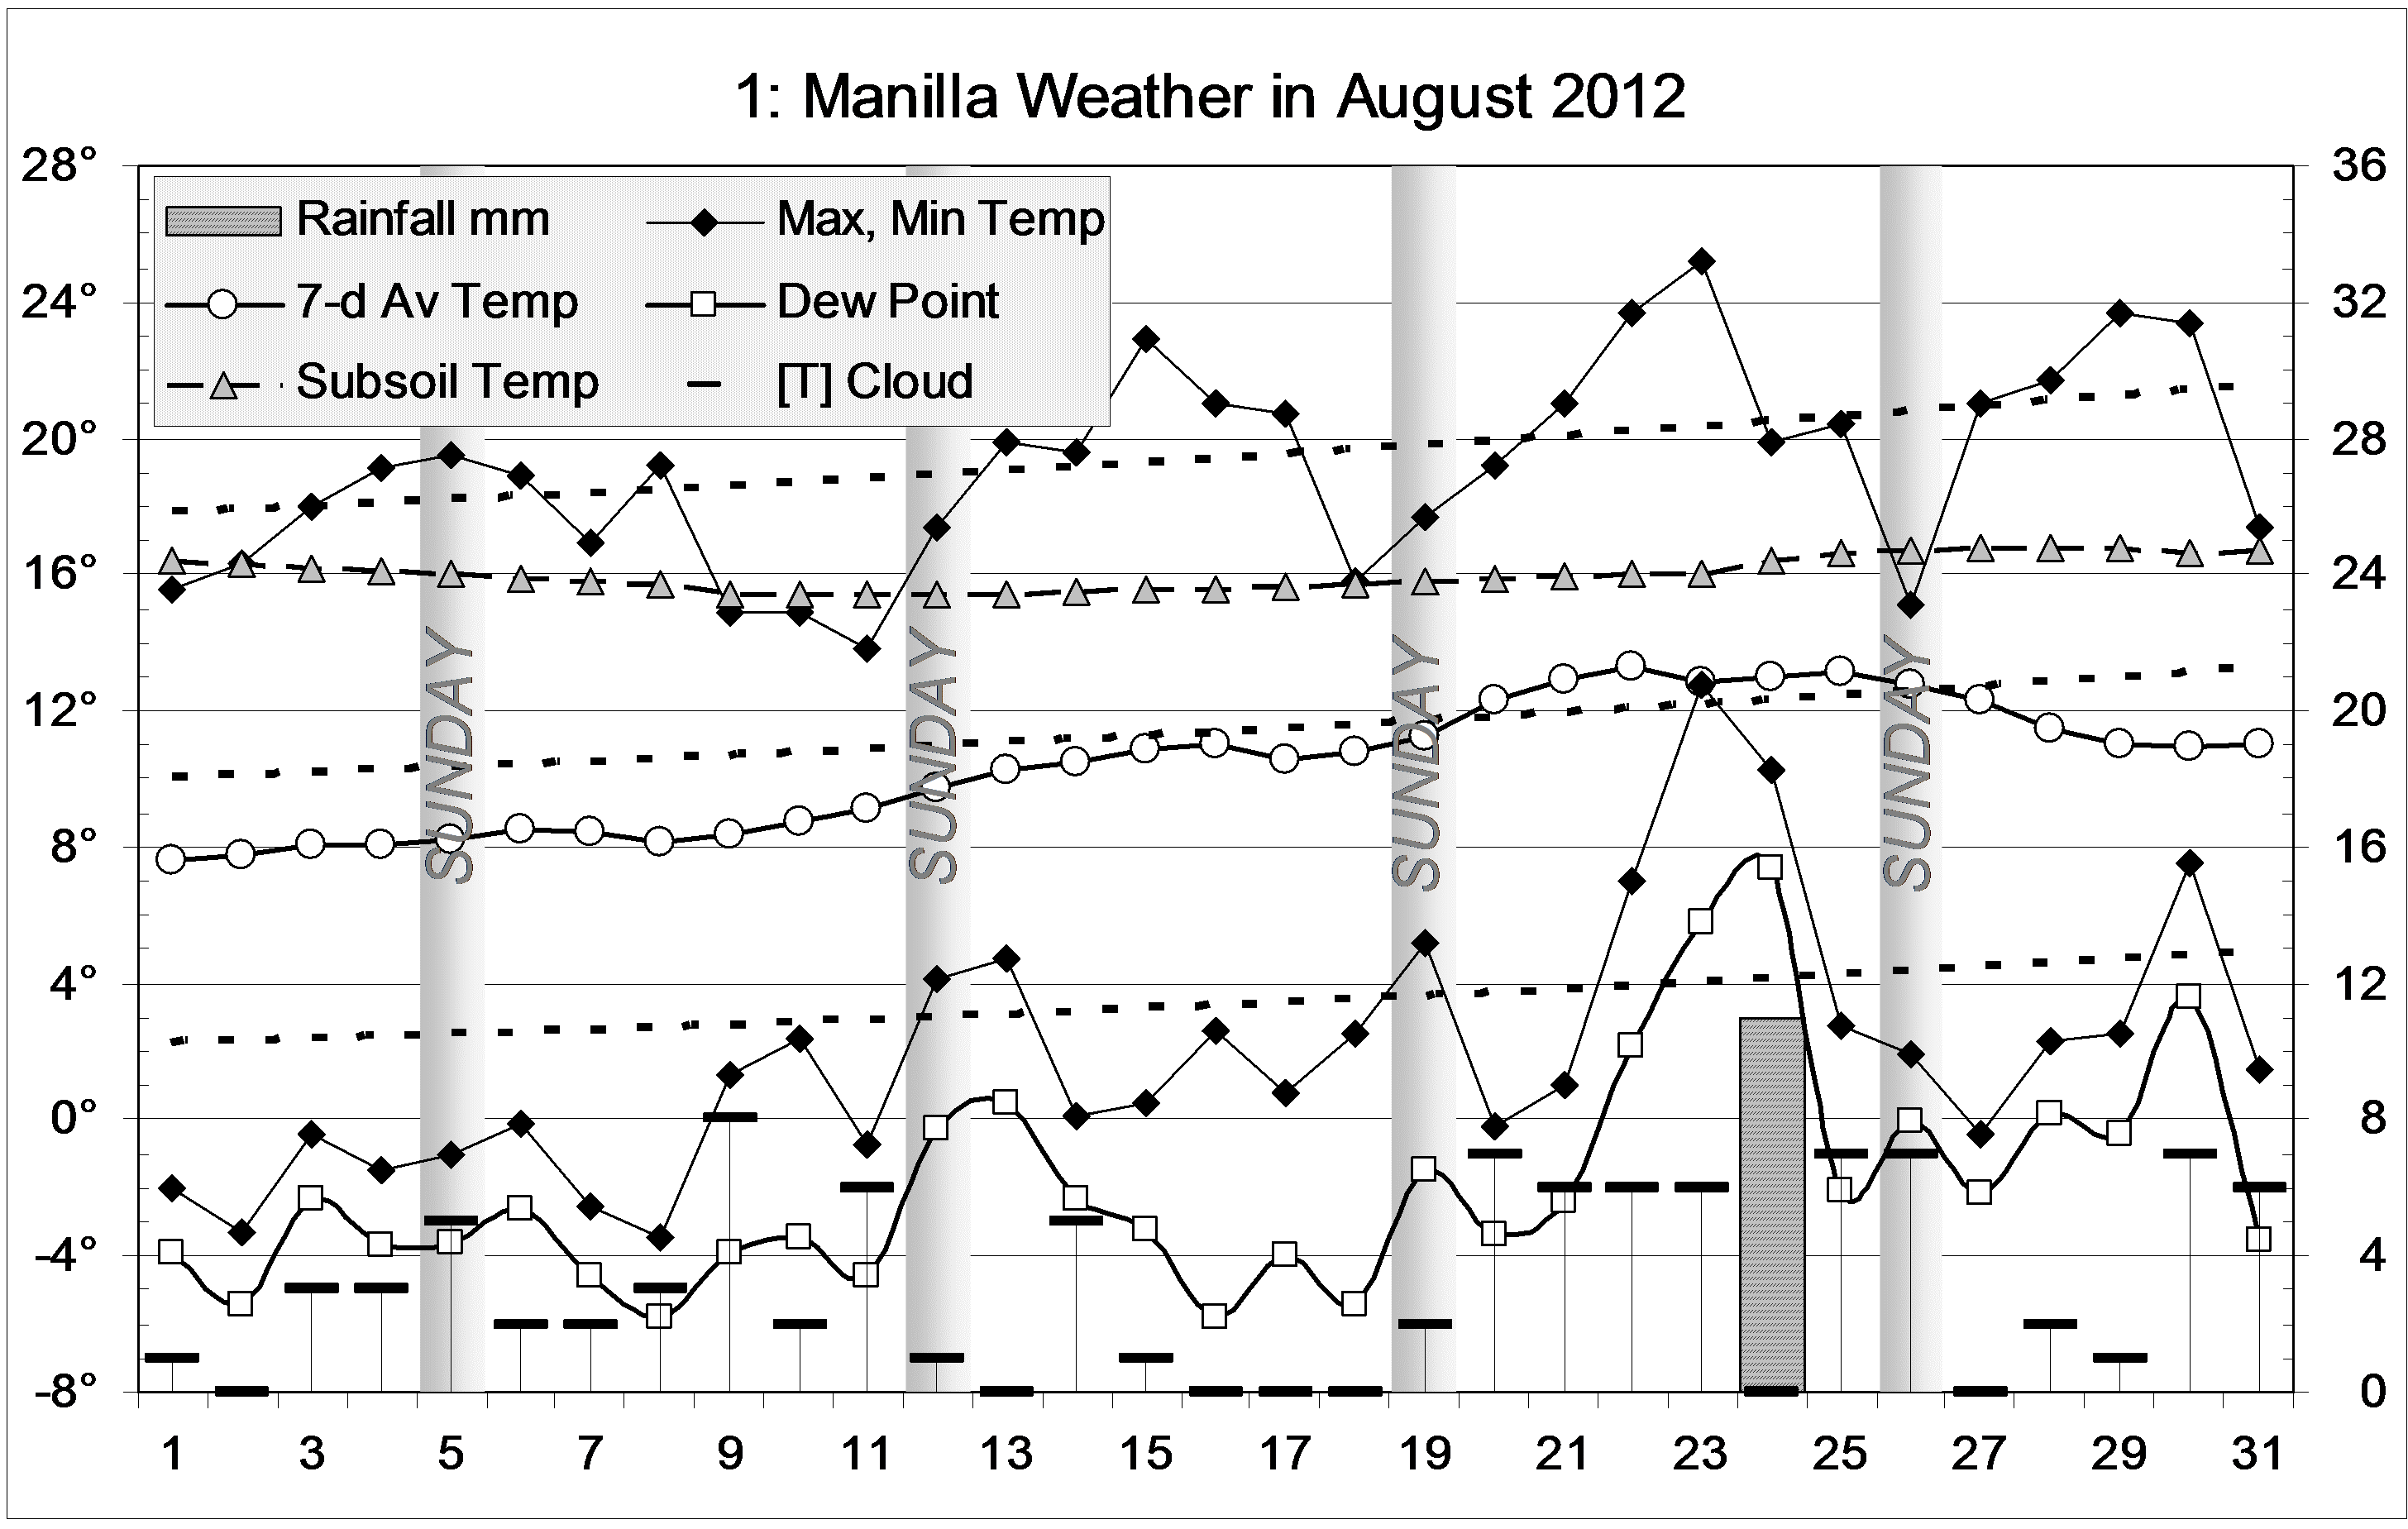
“Still Very Dry Air”

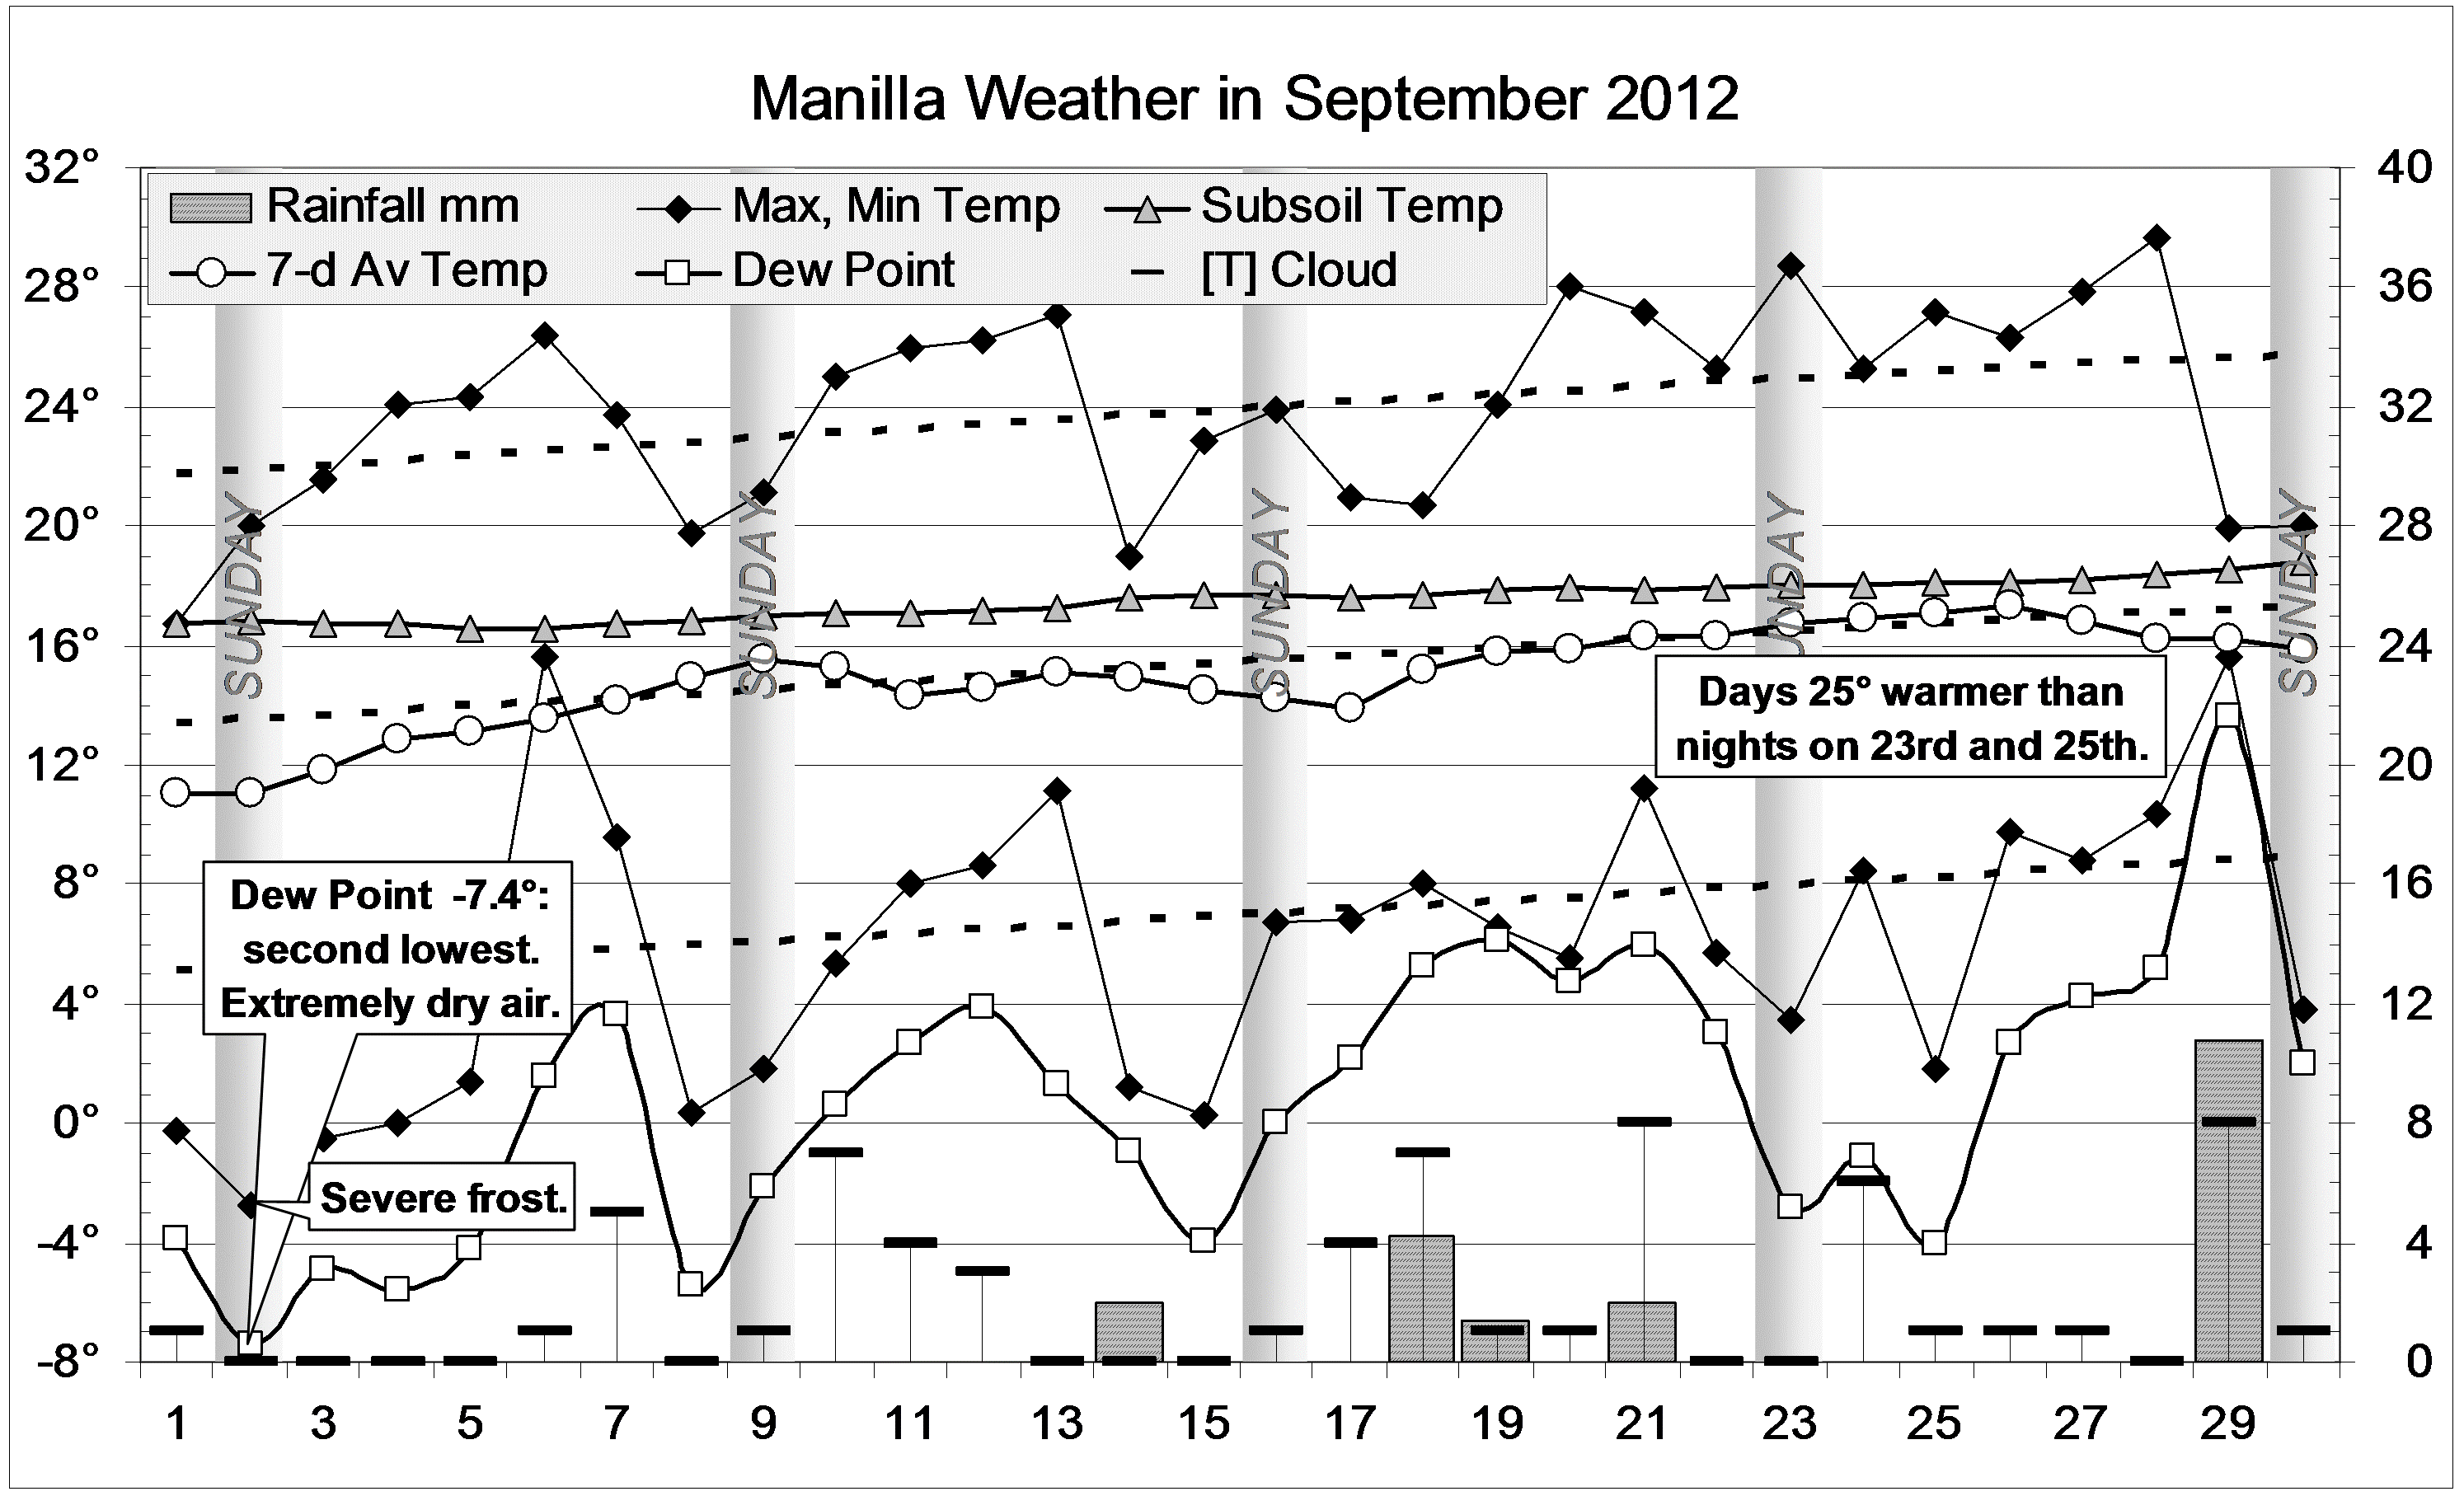
In September, daily maximum temperatures finally rose above normal. As in August, Dew Points (humidity) remained extremely low, daily minimum temperature very low, rainfall low, and daily temperature range very high. Cloudiness finally fell below normal, and subsoil temperature fell towards normal.
Fully-smoothed data (in red) now include March 2012. All variables for that month show a retreat from the “flooding rains” climate peak. Because the daily minimum temperature anomaly did not reach a minimum in March as I expected, the sequence of peaks for individual variables must be amended as follows:
Nov-11: Rainfall (max); Subsoil temp (min);
Dec-11: Temp range (min); Dew Pt (max);
Jan-12: Temp max (min);
Feb-12: Temp min (min).
The February 2012 value of smoothed minimum daily temperature anomaly (-1.11 degrees) was not quite as low as the record set in March 2008 (-1.17 degrees).
Note: Fully smoothed data – Gaussian smoothing with half-width 6 months – are plotted in red, partly smoothed data uncoloured, and raw data for the last data point in orange. January data points are marked by squares. Blue diamonds and the dashed blue rectangle show the extreme values in the fully smoothed data record since September 1999.