The daily weather log
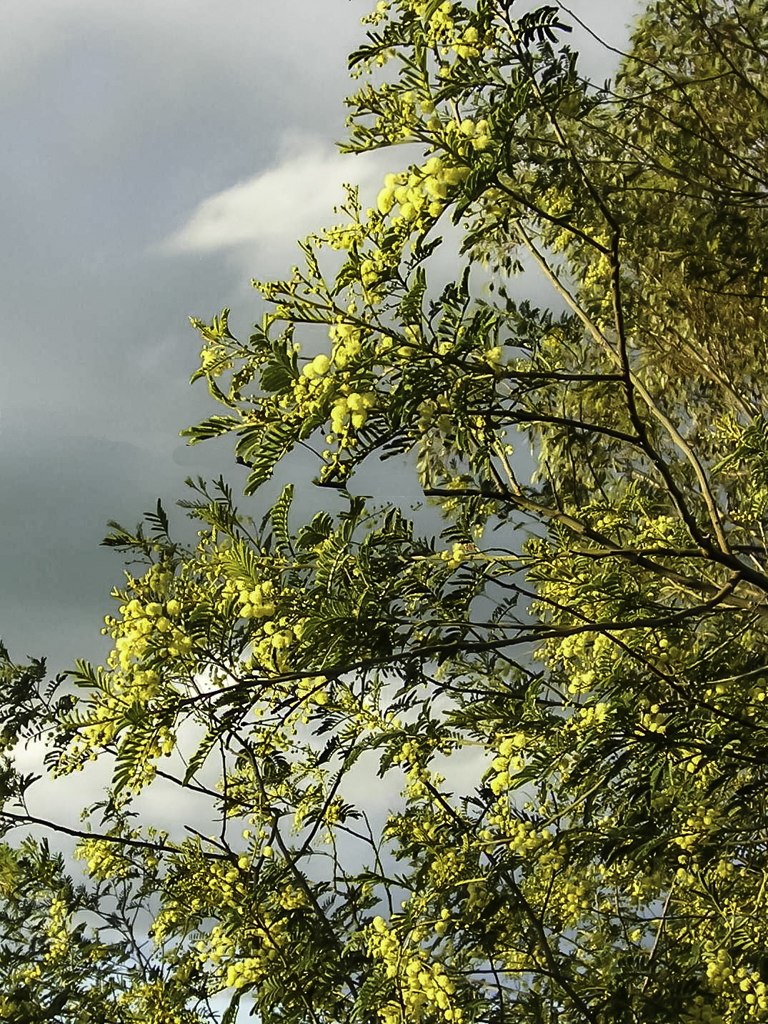
April-blooming Deane’s wattle
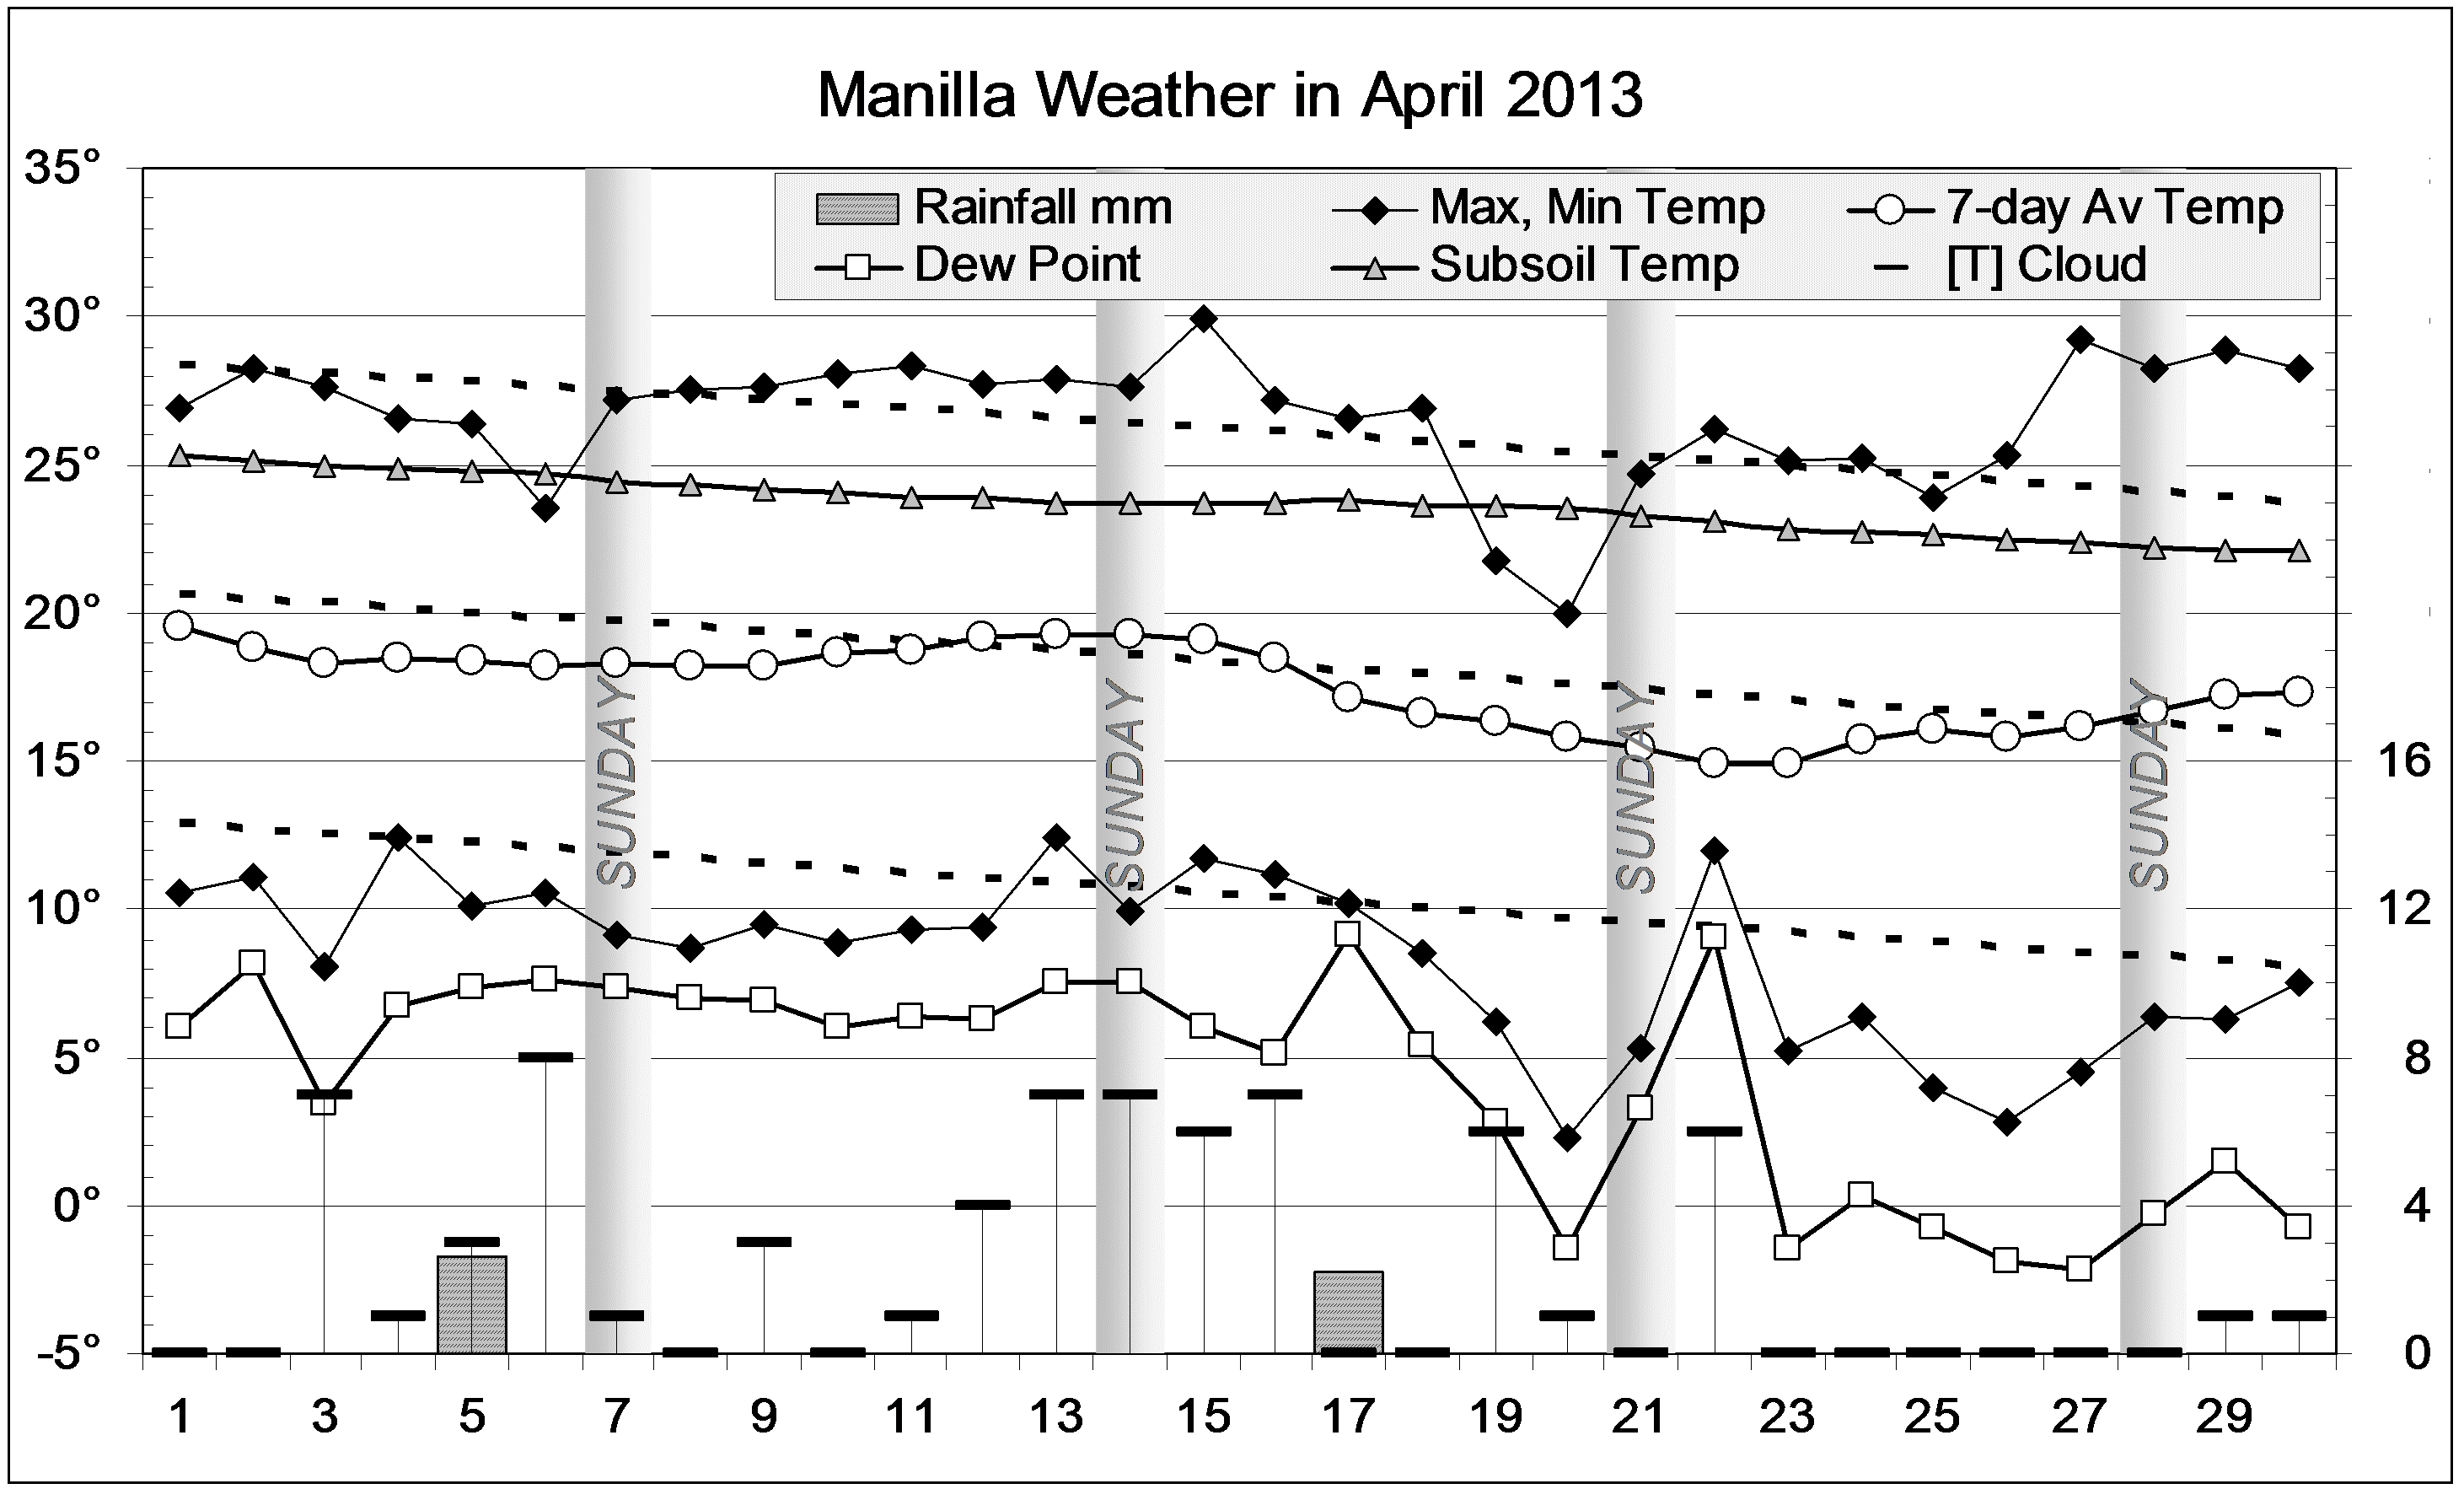
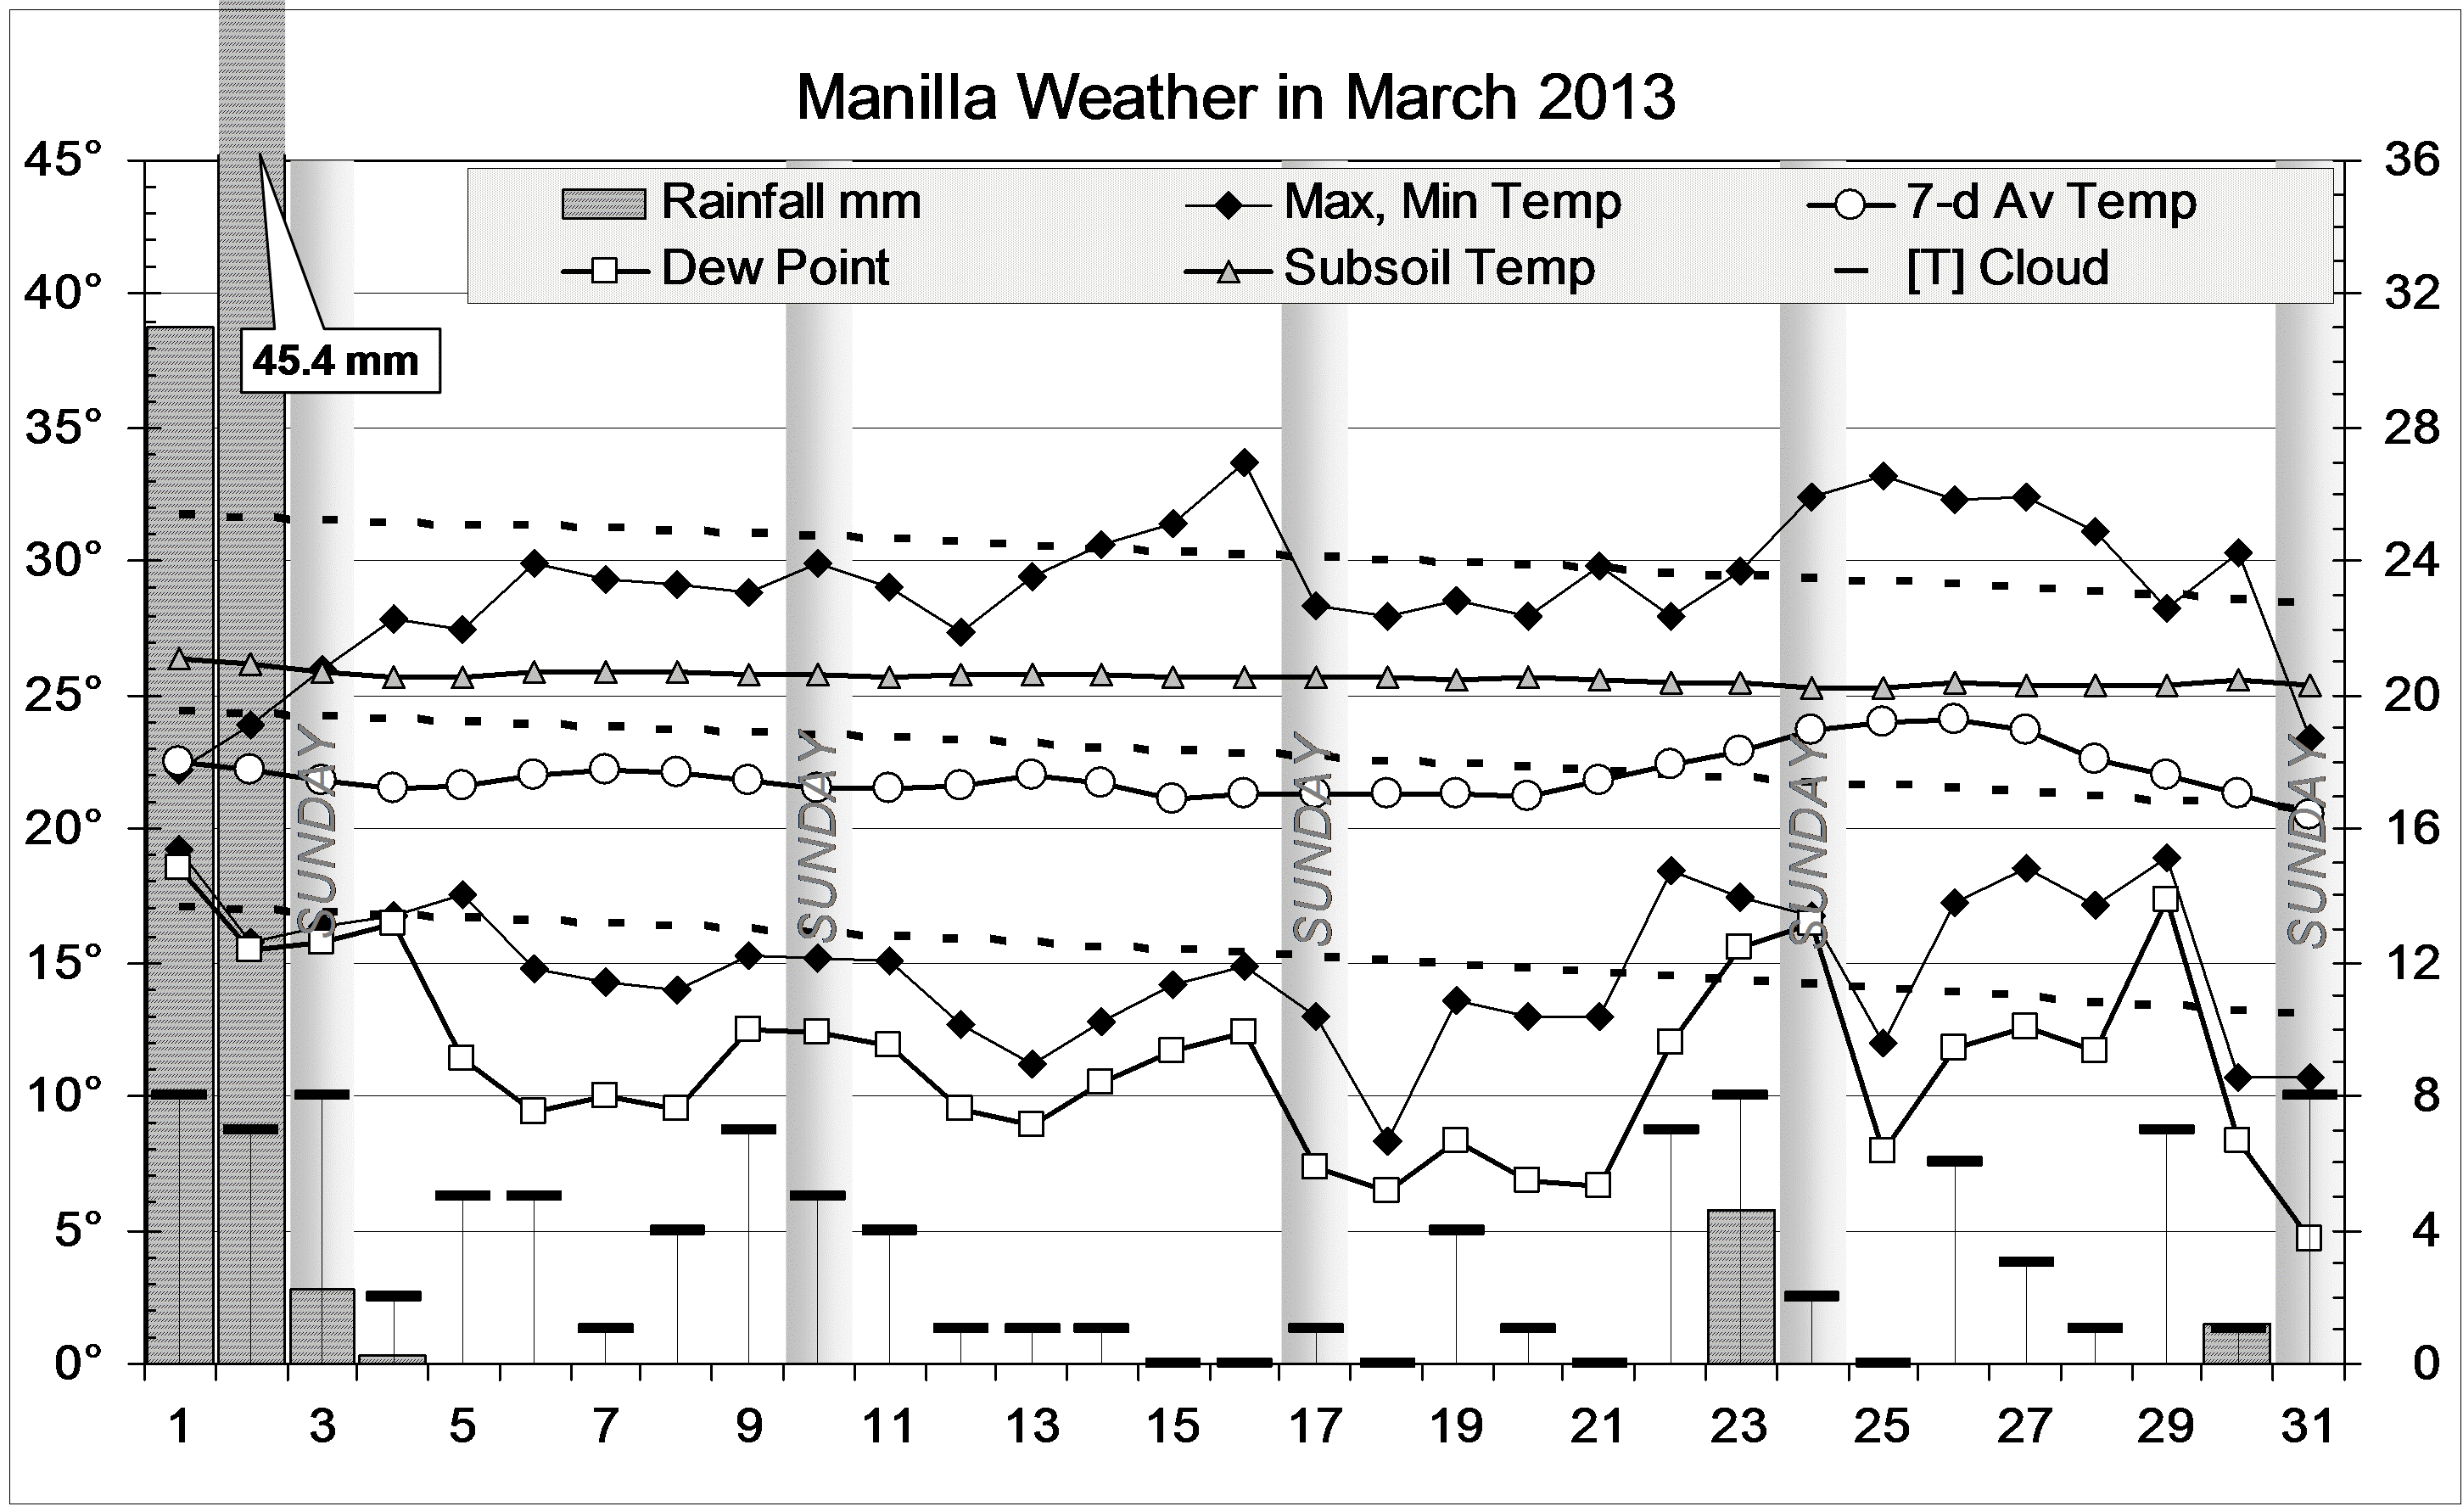
After a cool wet week at the end of March, April began warm, especially at night. The night of the 5th, at 18.8°, was the second warmest April night. Rain fell overnight, and the dew point, 18.5°, was an April record. The third week was sunny but cool, and the fourth week nearly four degrees warmer than usual. The last day of the month was suddenly cold (16.9°) and overcast, with drizzle.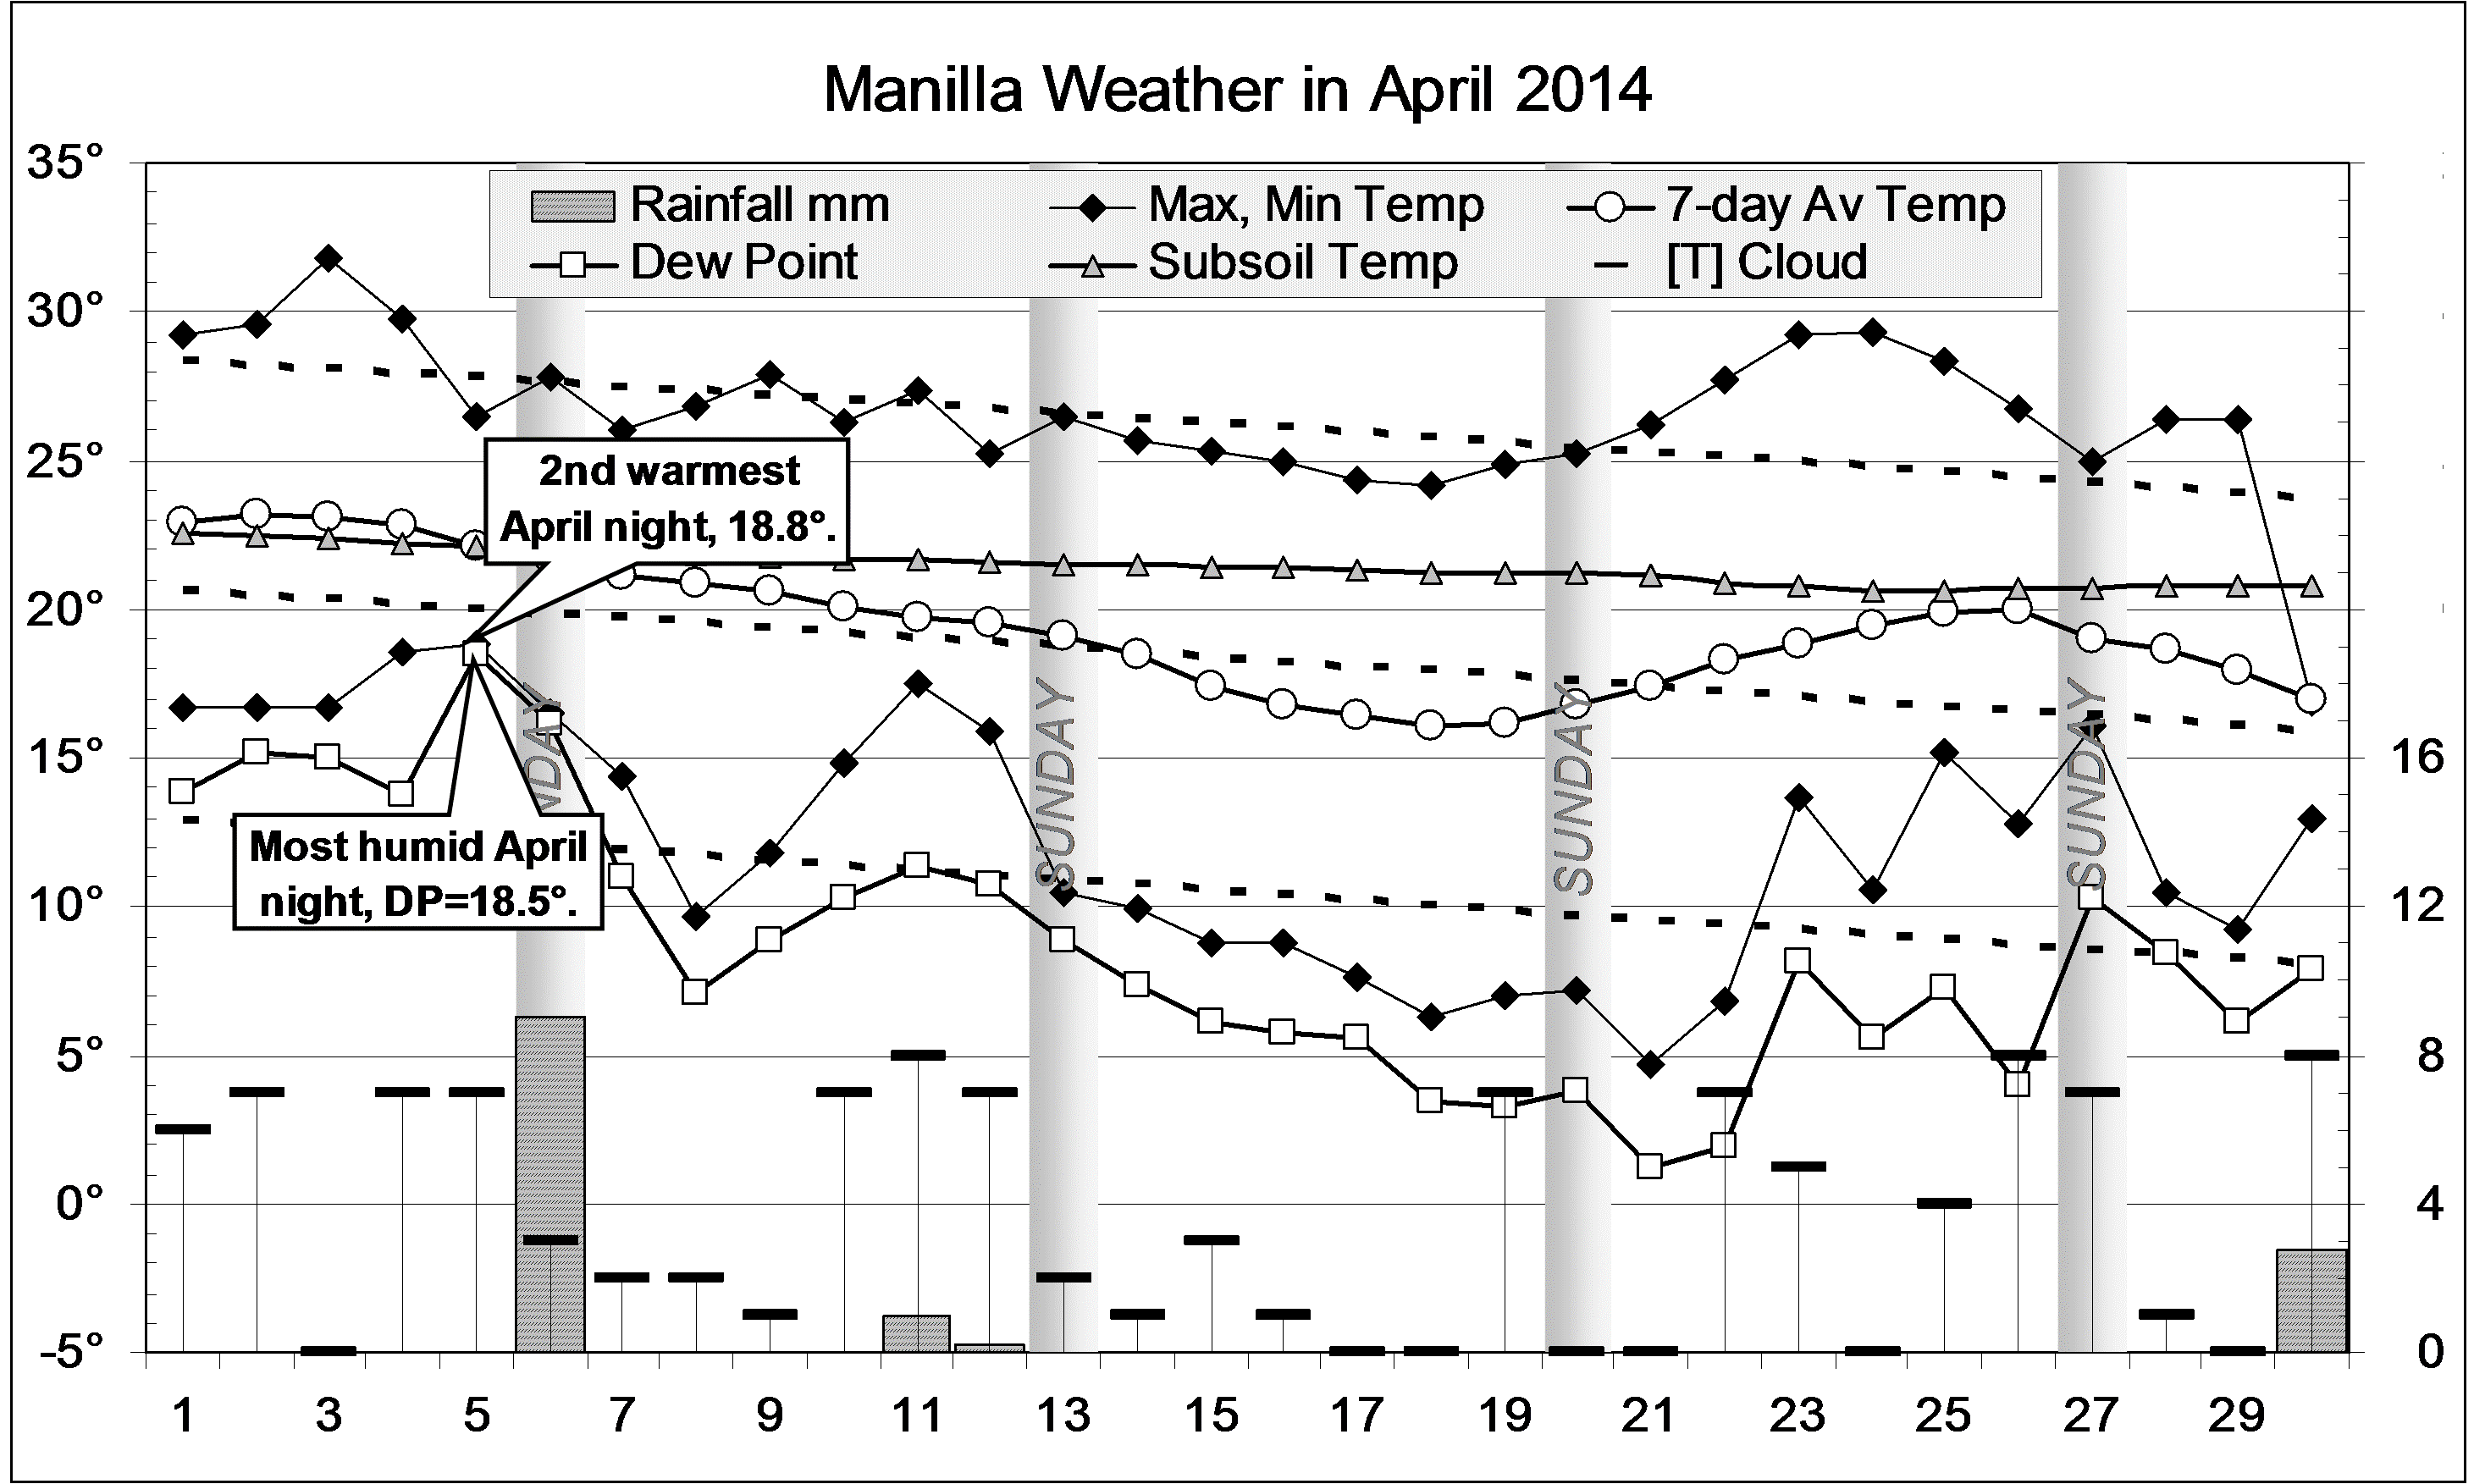
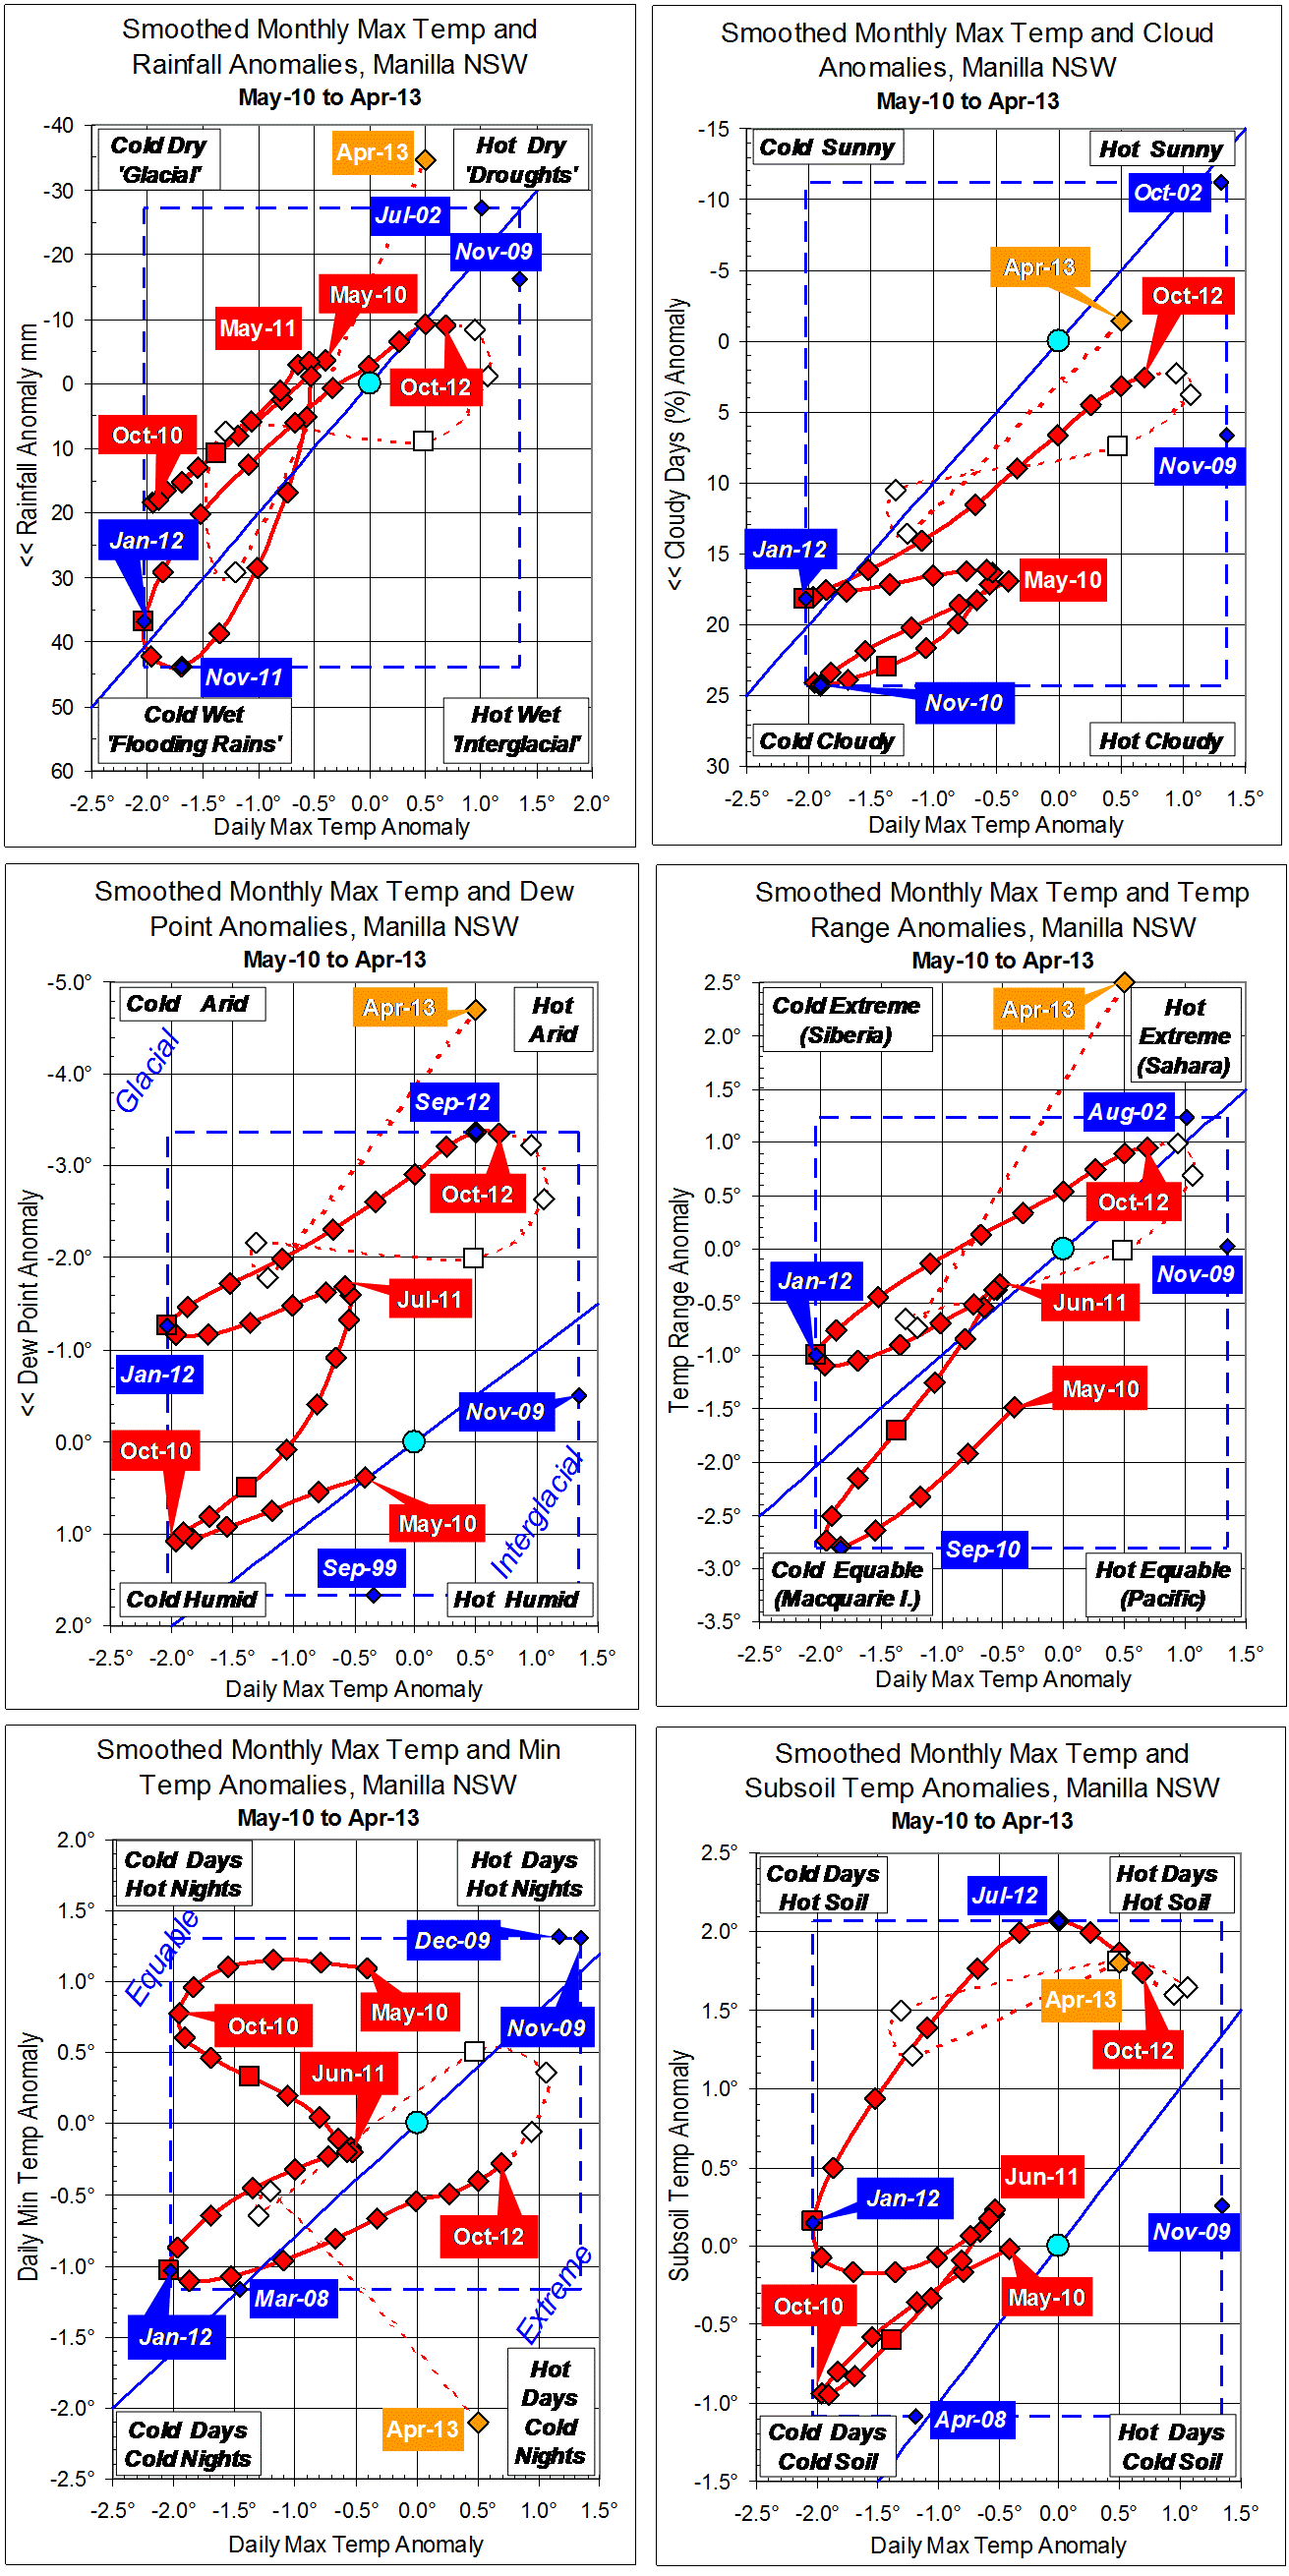
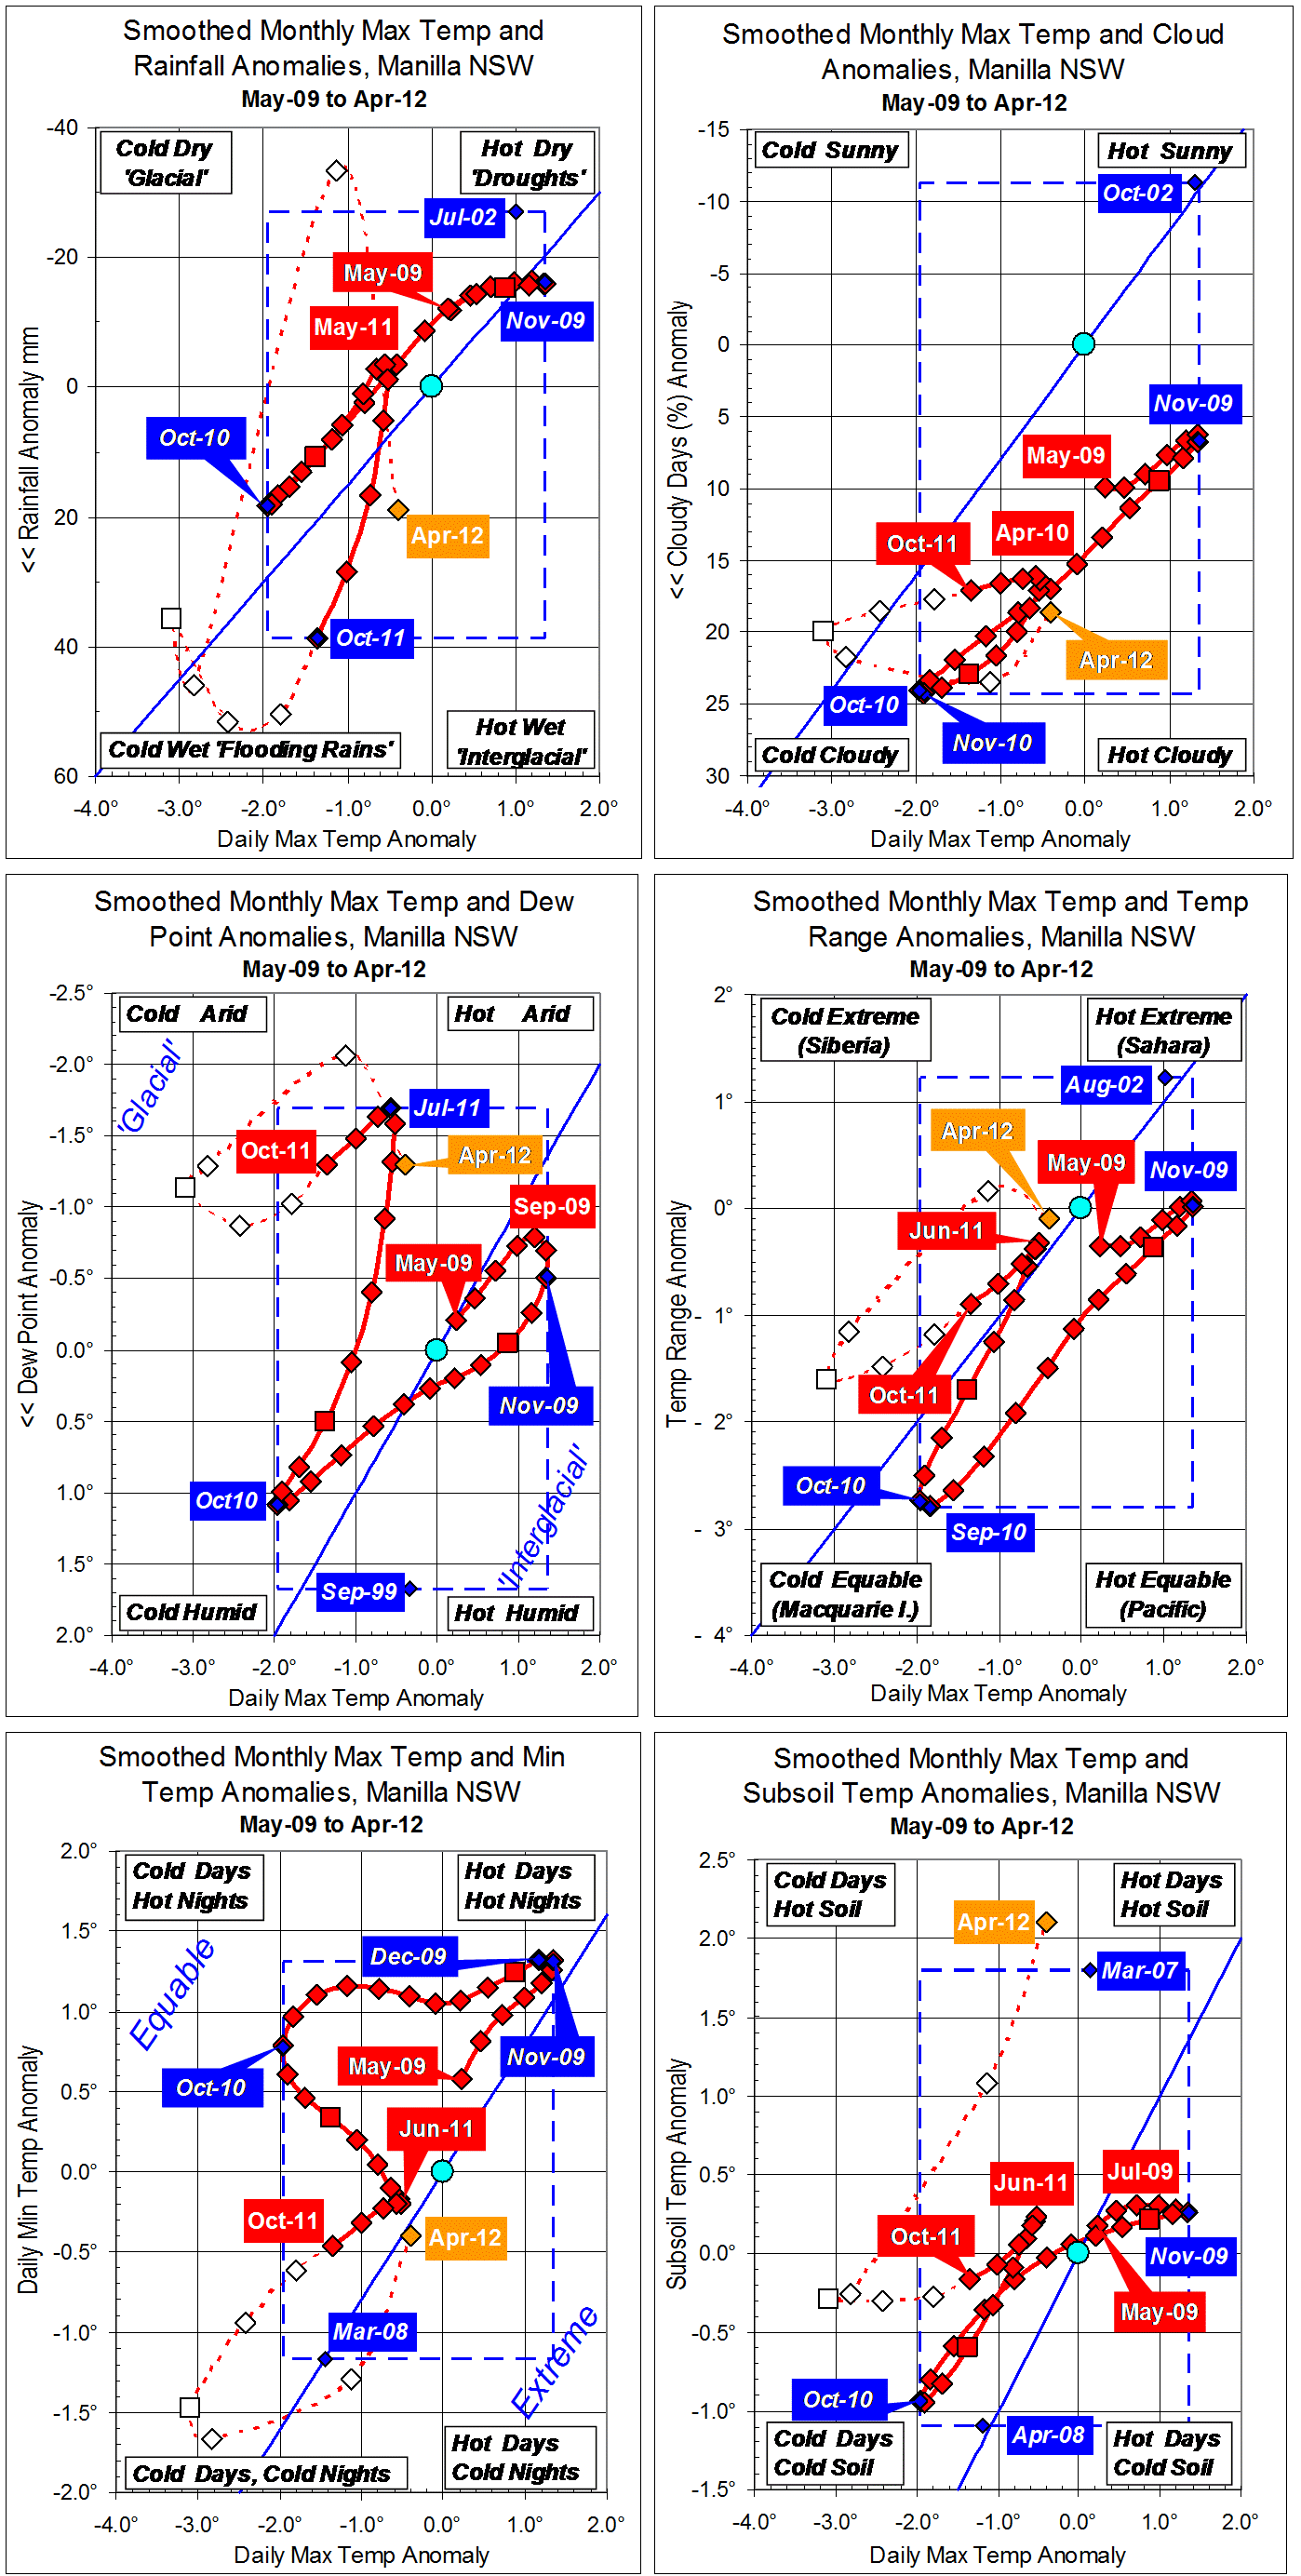
Comparing April months
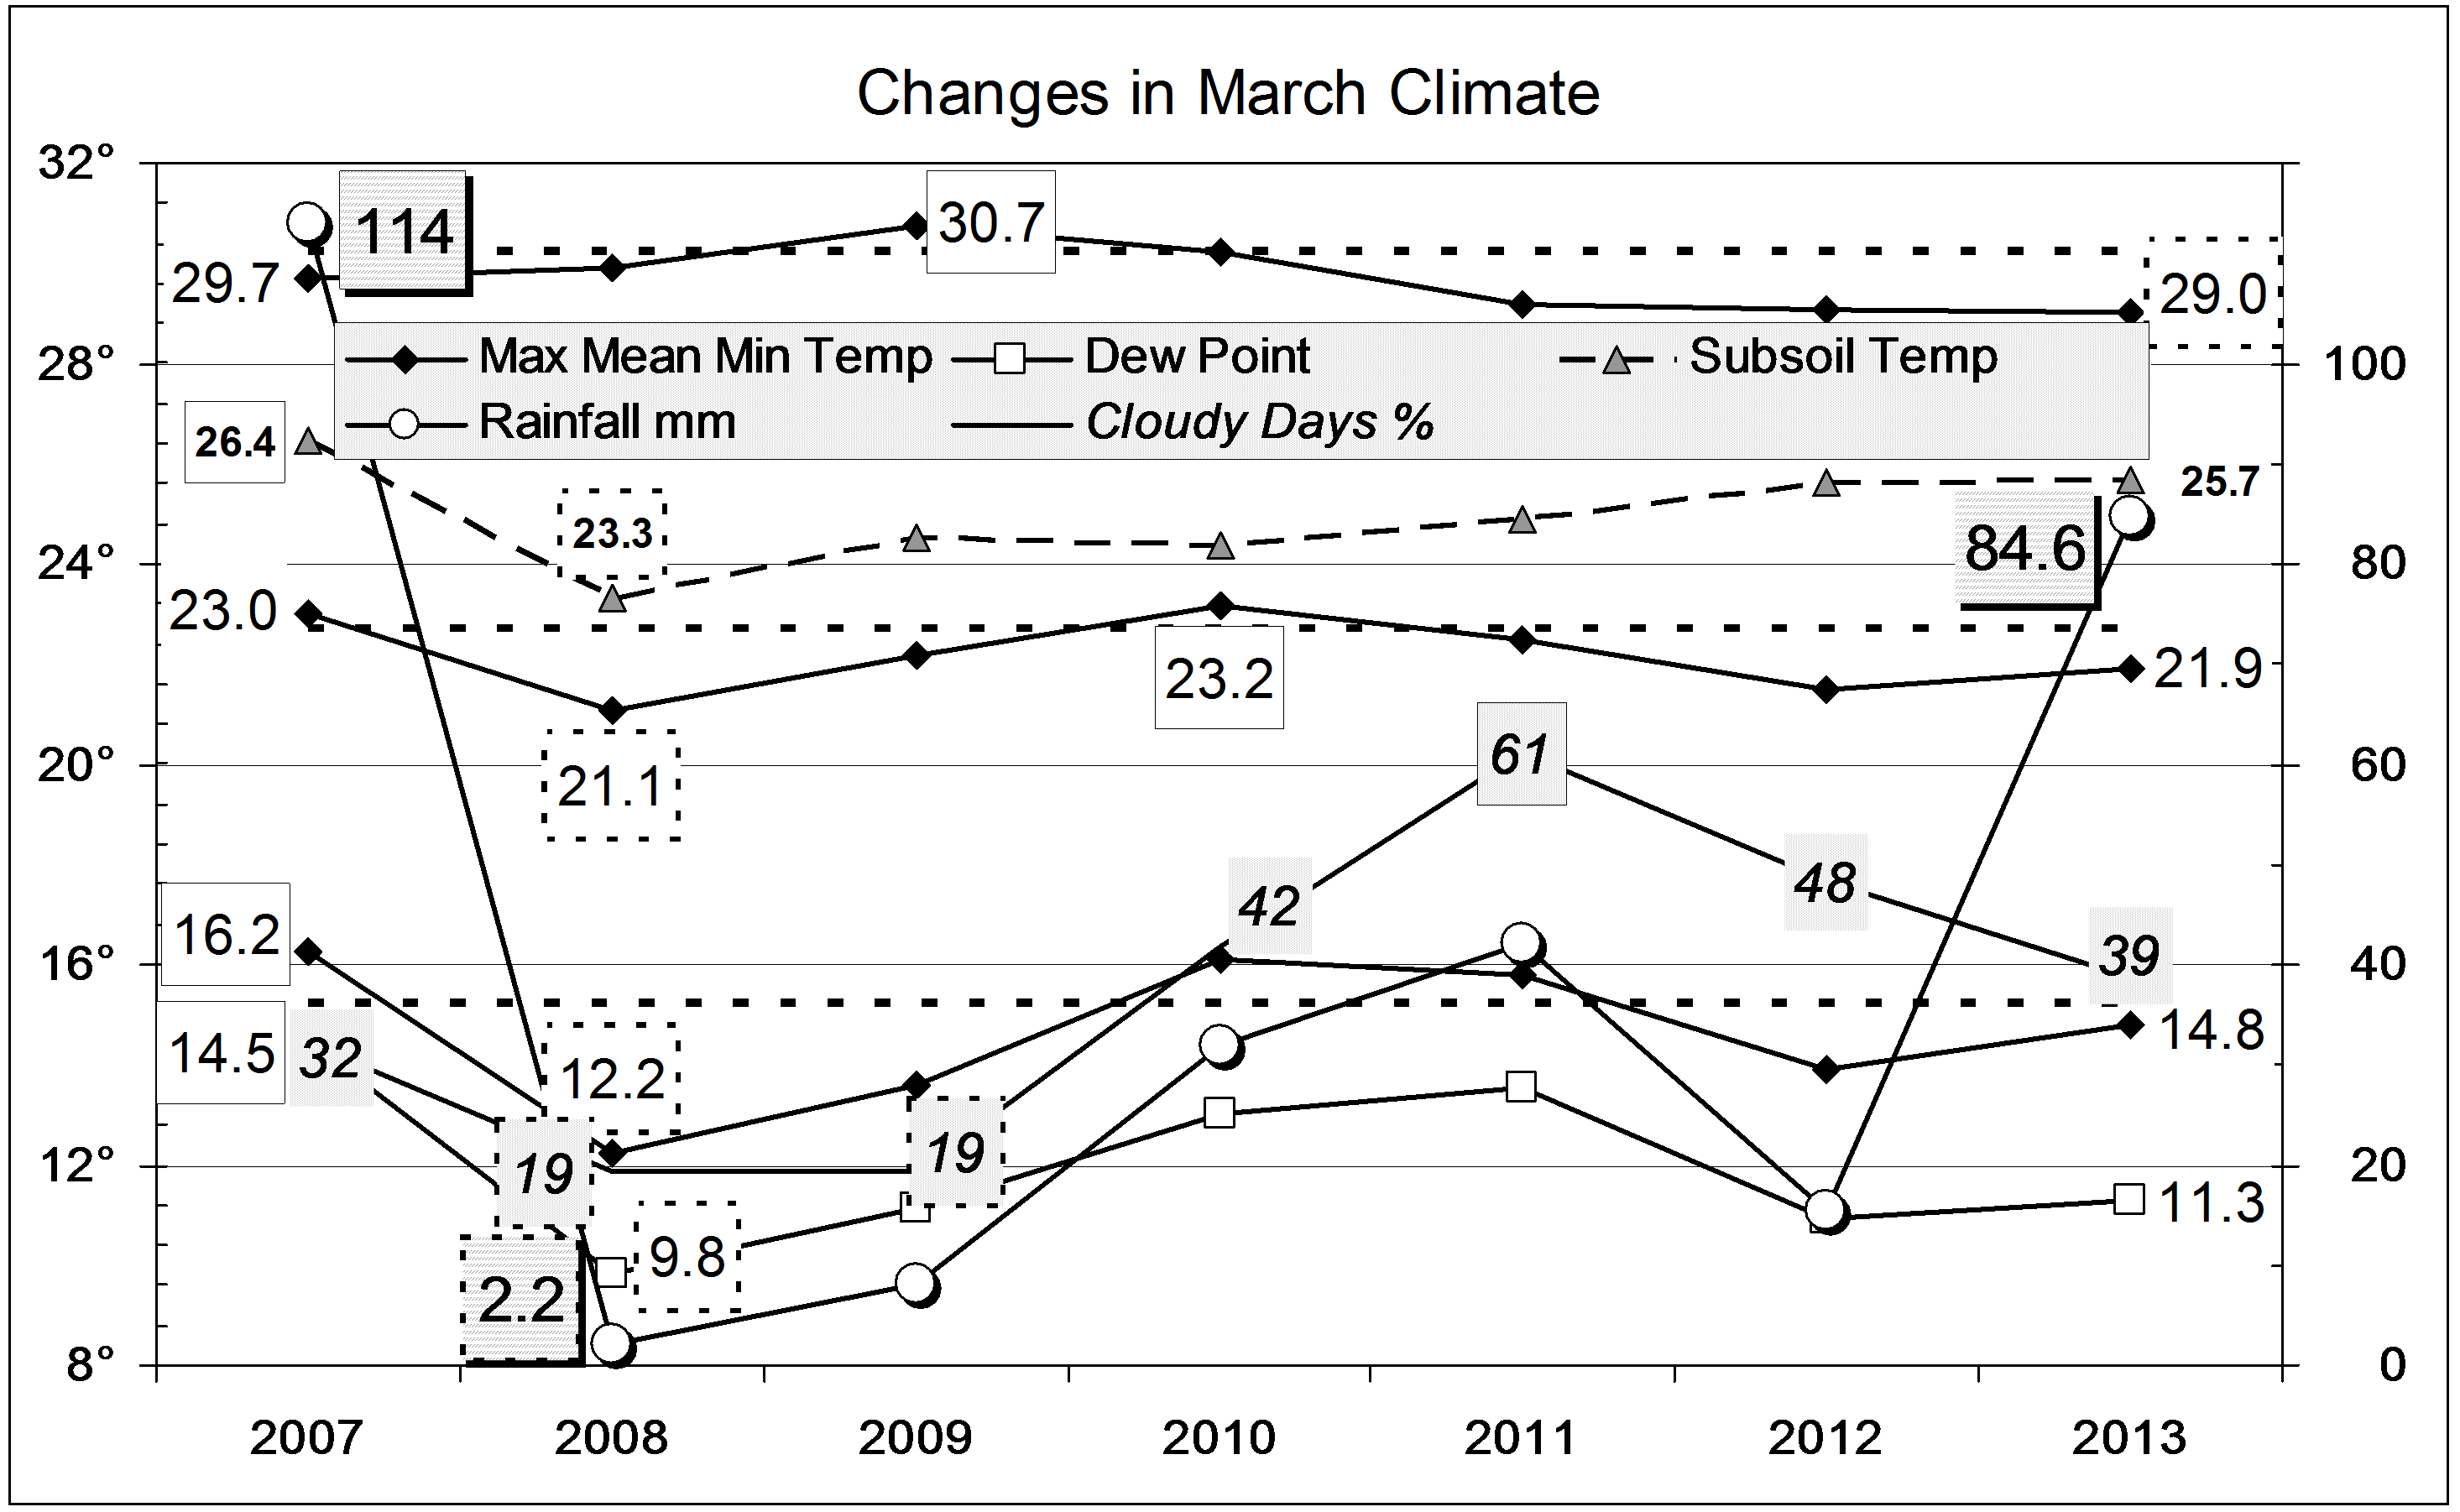
The mean minimum temperature was a record 1.7° above normal for the month, warmer than in April 2005, and the mean maximum temperature was also slightly up. The subsoil, after more than two years above normal (by as much as 2.4° in winter 2013), finally cooled down in March and April.
Moisture was near normal, with low rainfall offset by cloudy skies.
Although the total rainfall of 13.0 mm was below the April average (40 mm), it was not unusually low but in the 28th percentile. Taking rainfall totals for more than one month, the greatest shortages are not serious (i.e. not below the 10th percentile). The nine month total (336 mm) is in the 14th percentile. Other totals have higher percentile values, and most totals for 30 months or more are above normal. Pools still survive in Greenhatch Creek.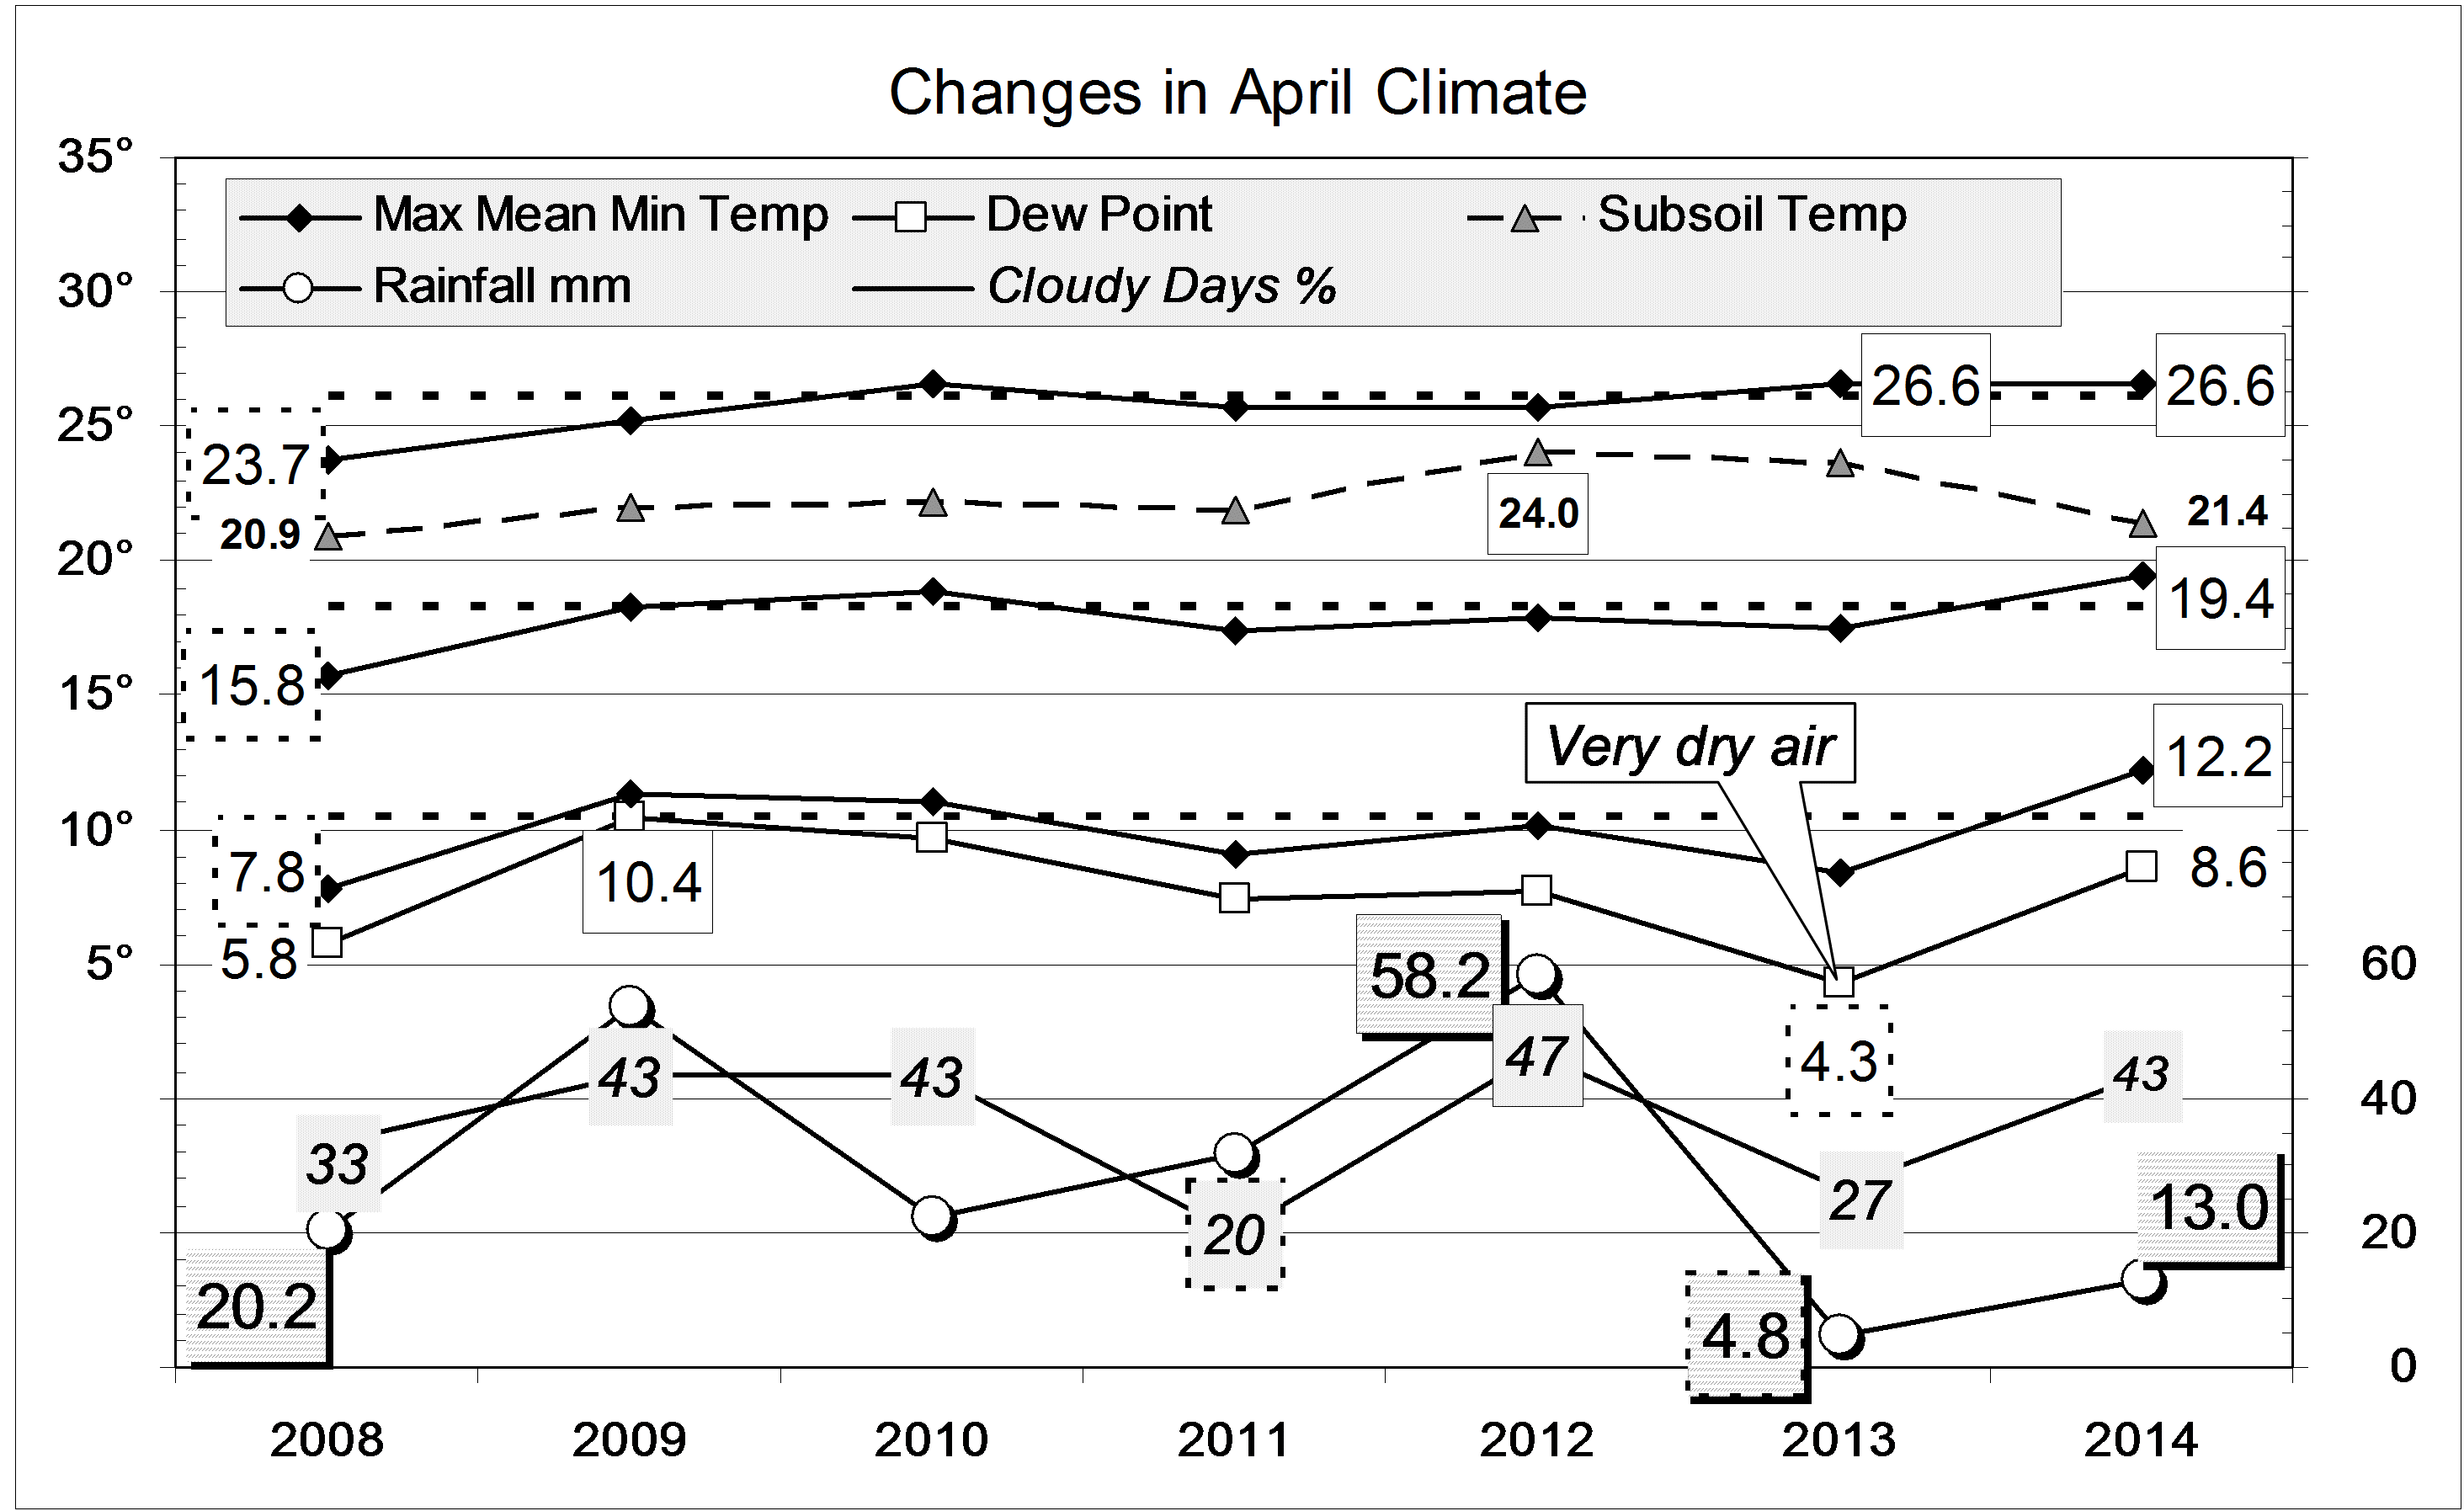
Data. Rainfall data is from Manilla Post Office, courtesy of Phil Pinch. Temperatures, including subsoil at 750 mm, and other data are from 3 Monash Street, Manilla.