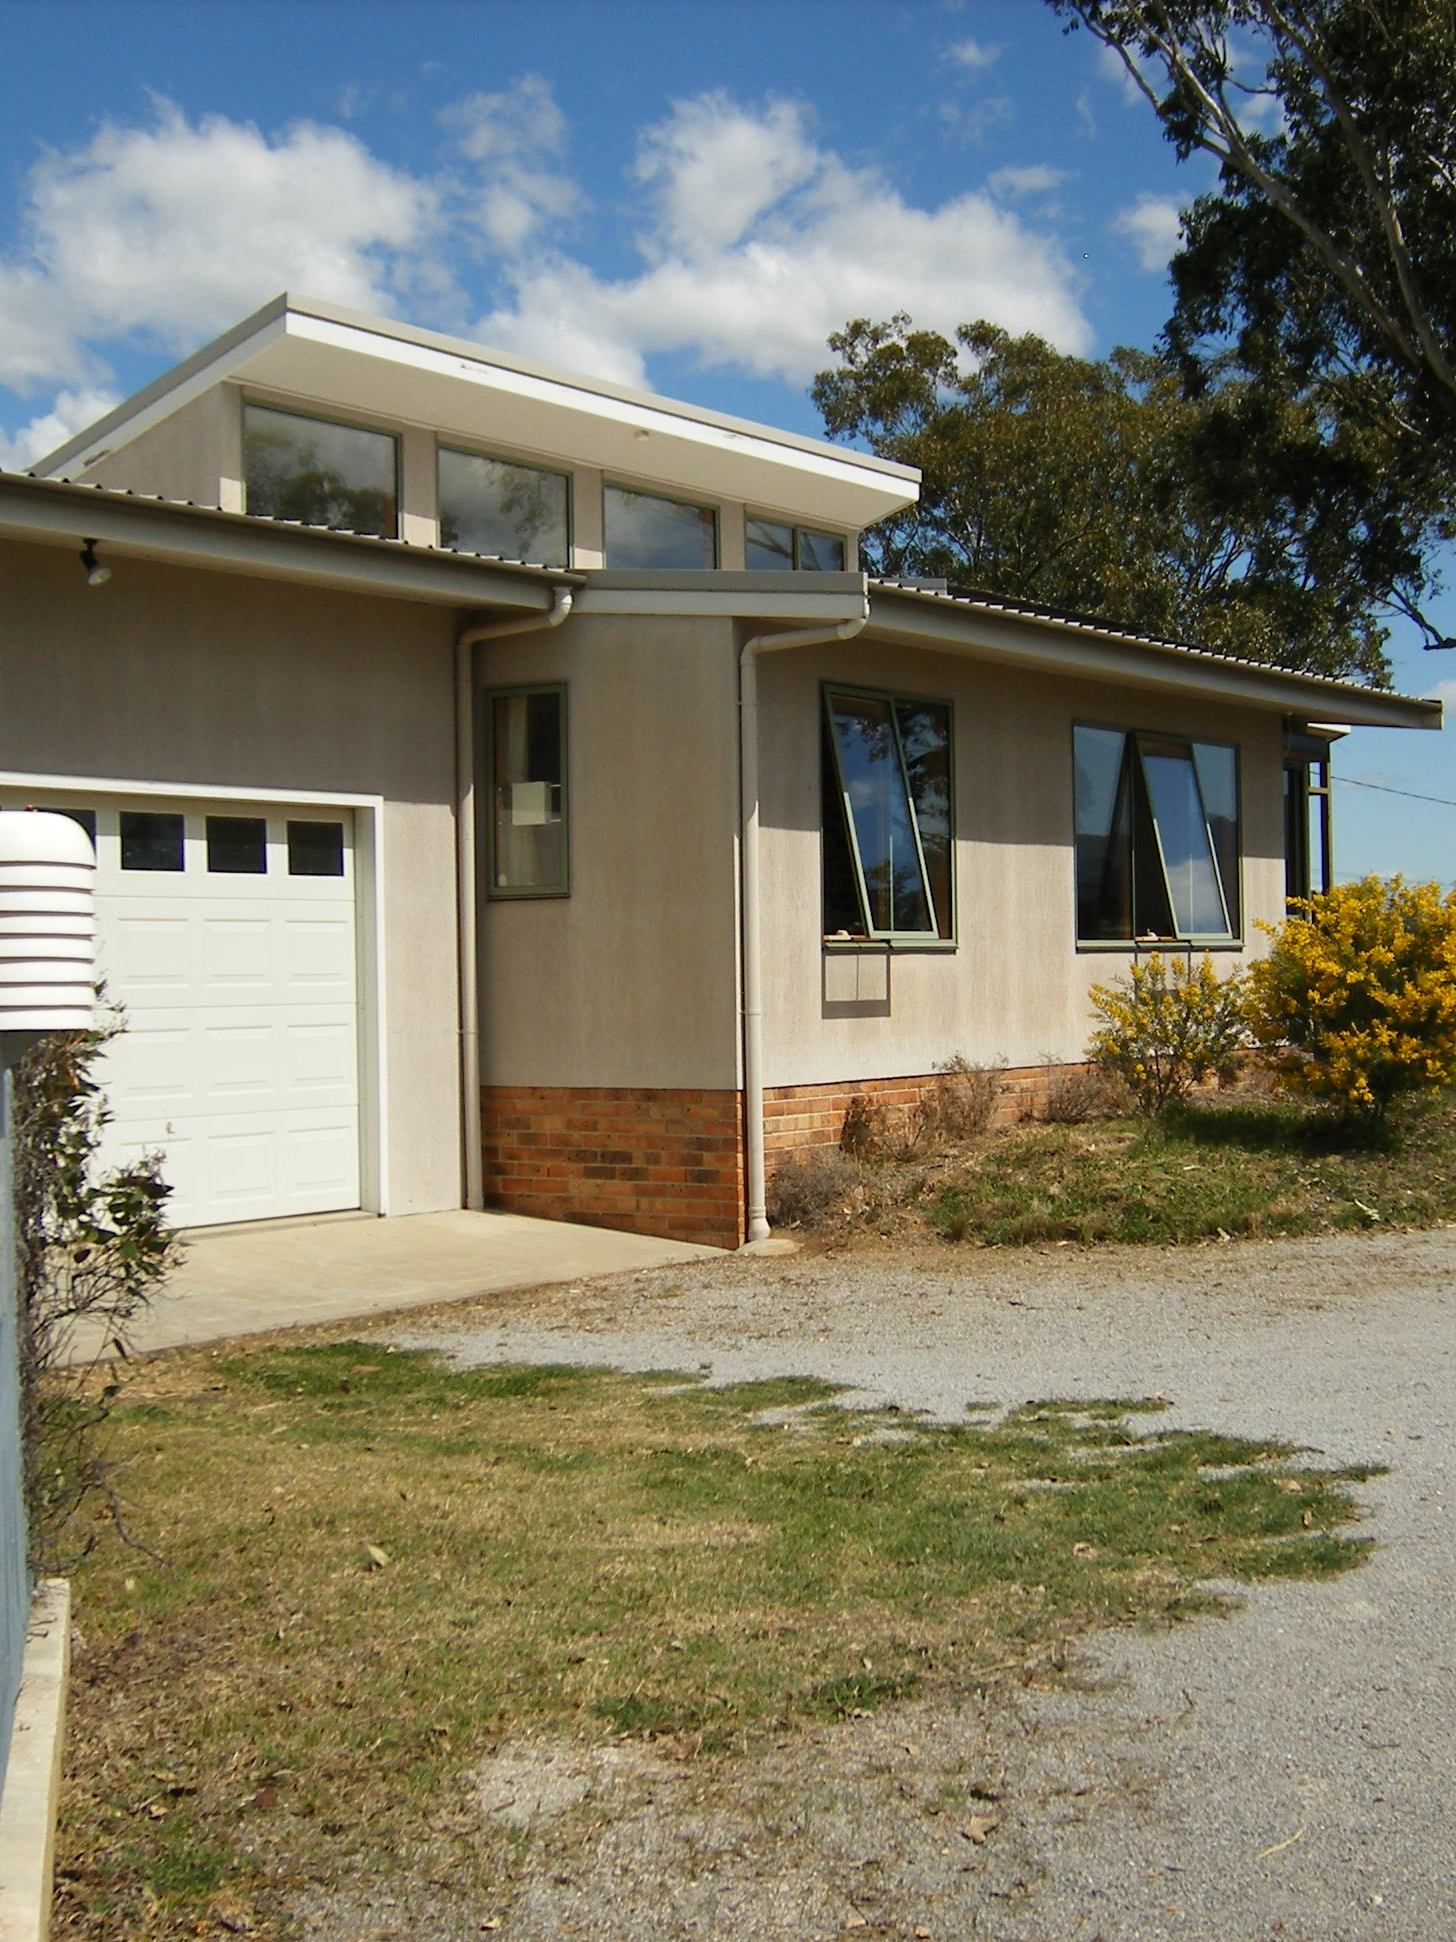
Geoff’s solar-passive house
A second high-mass solar-passive house was built in 2009 in Strafford Street Manilla, within 300 metres of my house in Monash Street.
My friend Geoff designed his house and used the same builder that I did. Sadly, after five comfortable years in his house, Geoff has passed away. Thanks to his daughter, I can show you the features of the house.
Thermometers, and power bills show that its performance is similar to mine. That is to say, it is very successful!
In Manilla’s climate of daily and seasonal temperature extremes, Geoff rarely needed to use his low-powered reverse-cycle air conditioner.

Strafford Street solar-passive house: plan
Specifications
Dimensions
Length, East-West: 18.28 m
Width, North-South: 9.45 m
Ceiling height: 2.70 m
Area
Room area, Living/Kit/Bed 1/Study: 115.9 m^2
Room area, Bed 2: 13.8 m^2
Room area, Bed 3: 14.1 m^2
Room area, Bathroom: 8.6 m^2
Room area, Laundry/Darkroom: 7.7 m^2
Area of walls: 12.7 m^2
Total House Area (without patio): 172.8 m^2
Exterior walls
North wall: double brick
East, west, and south walls: 90 mm stud, including 9.61 m reverse brick veneer
Cladding of stud walls: custom orb (horizontal)
Cladding of gable ends: plain roofing panels with 50 mm foam
Interior walls
Single brick: 17.16 m
Stud wall: 11.66 m
Windows (and two glass doors)
All double-glazed 3/6/3 in uPVC frames
(North-facing window area is 16% of the floor area of the house.)
North-facing: 27.00 m^2 (76%)
East-facing: 3.84 m^2 (11%)
South-facing: 4.50 m^2 (13%)
West-facing: 0.00 m^2 (0%)
Total: 35.34 m^2 (100%) Continue reading