
Parametric plots of smoothed climate variables at Manilla
“Dry air but not warm or sunny”
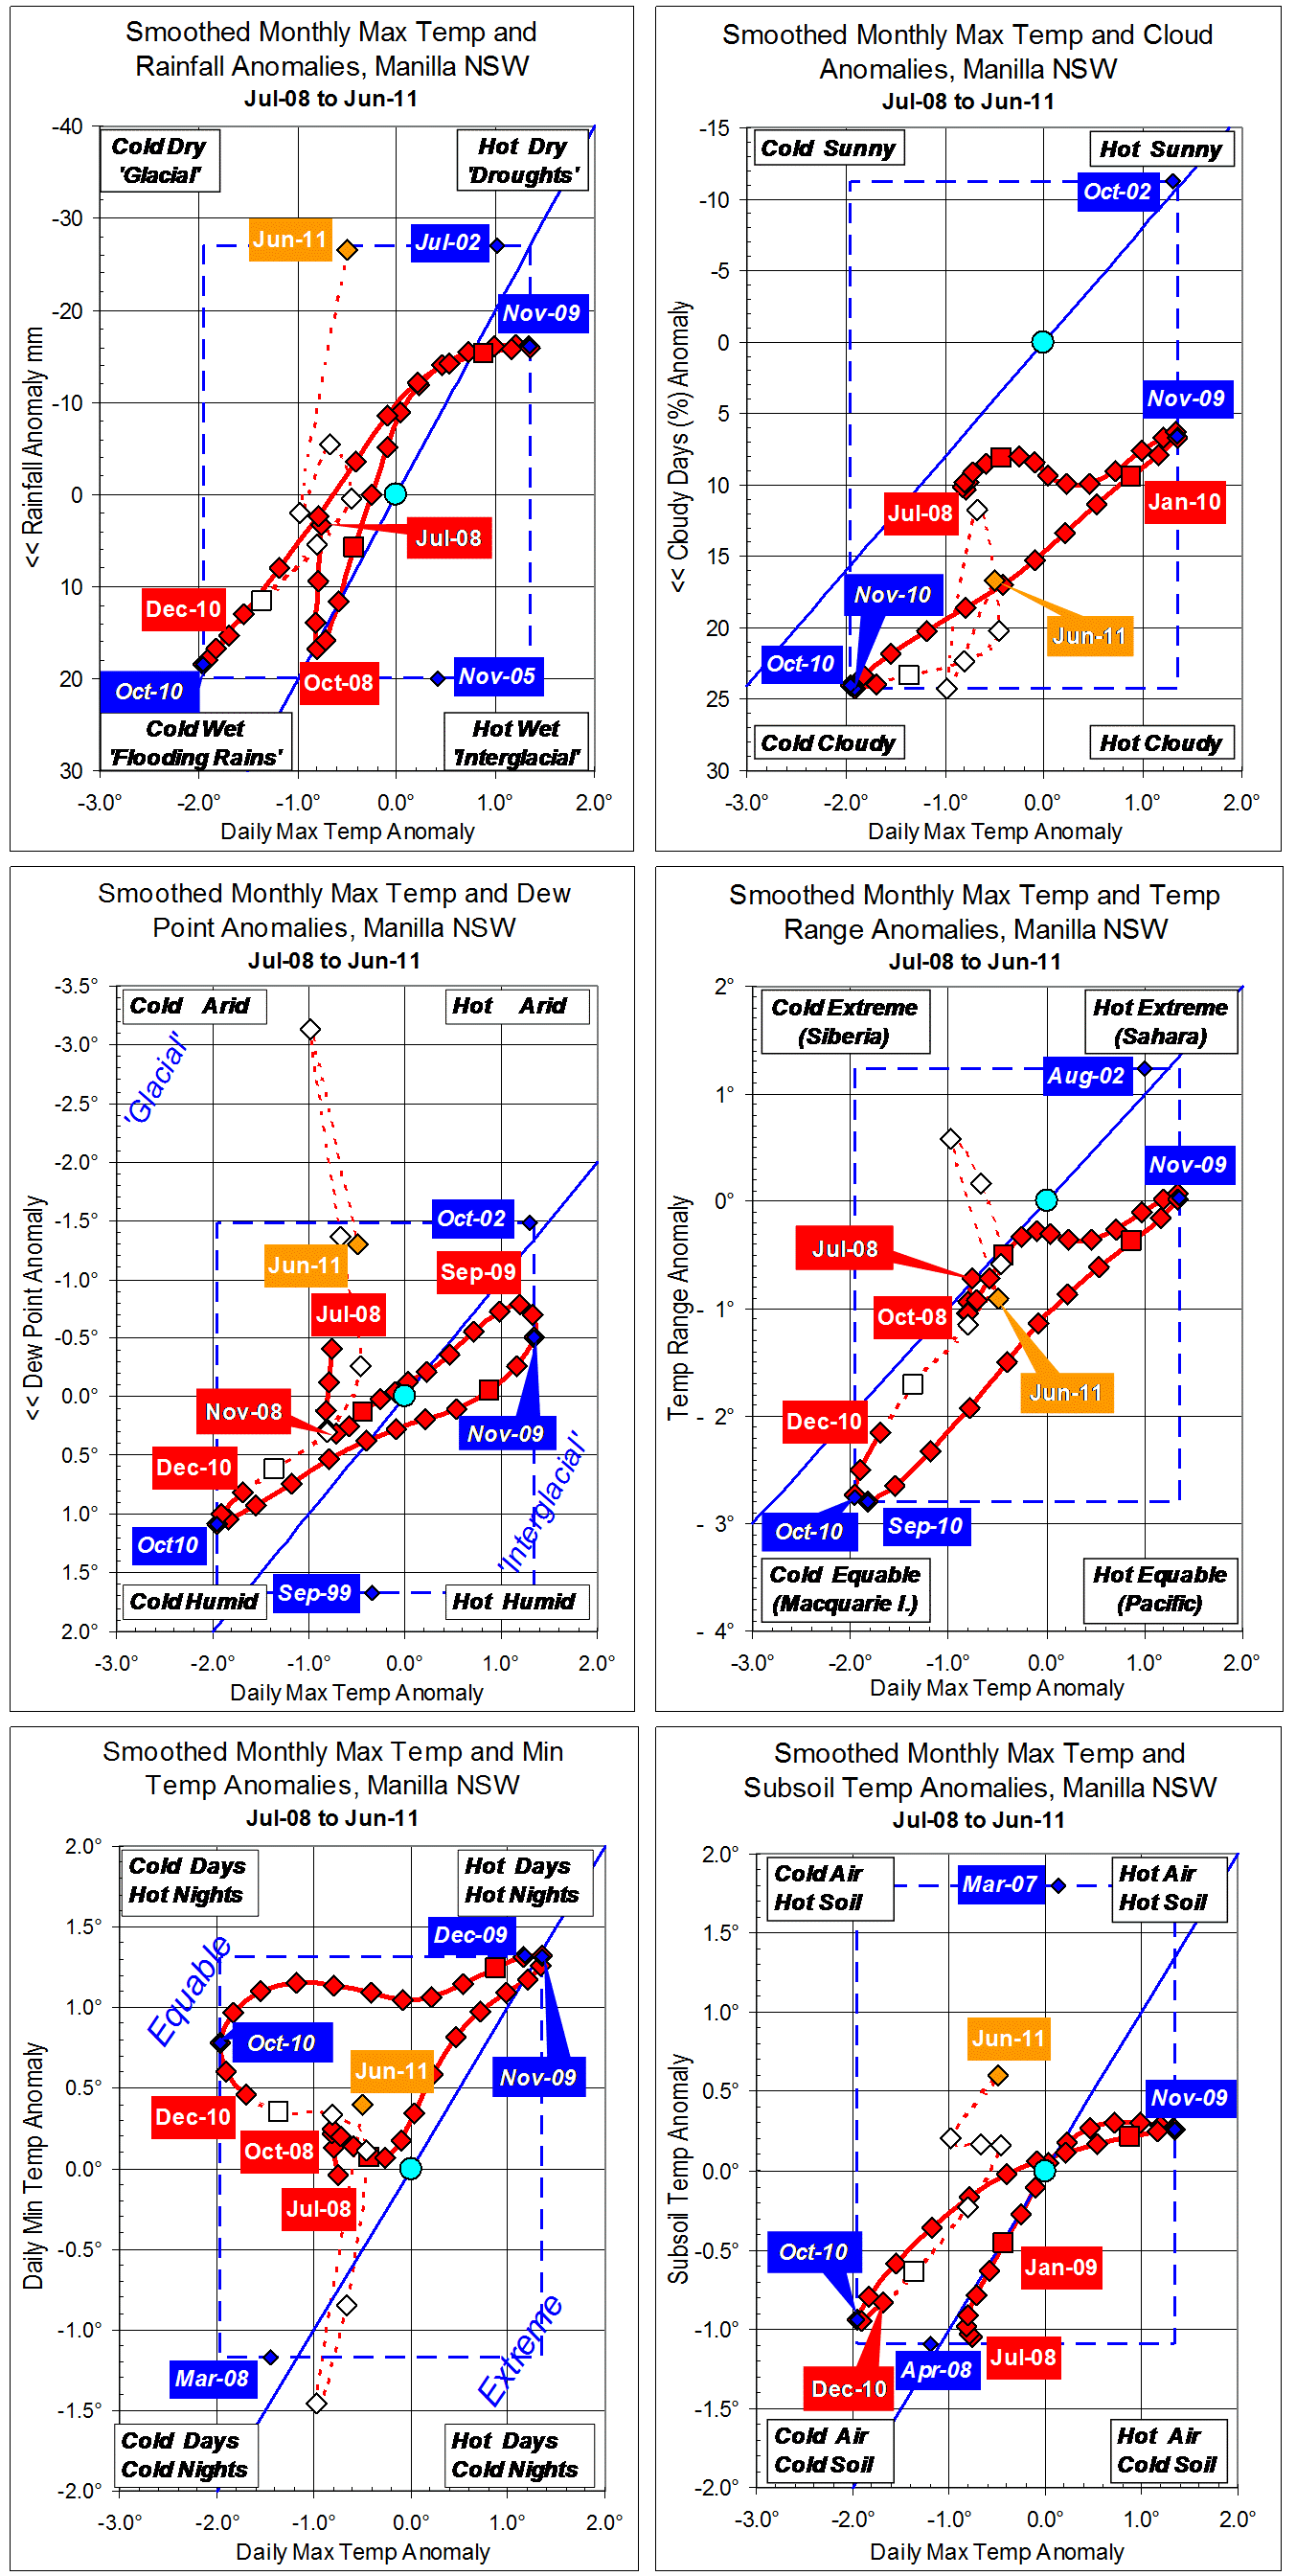
Raw anomaly data for June 2011 (shown in orange) are a little strange.
Daily max temperature, shown on the x-axis of all six graphs, has stalled without quite rising to normal from the extreme cold of last October.
Two variables indicate severe drought: Rainfall was very low, and so was the early morning Dew Point.
Most other variables are near normal, or slightly to the “flooding rains” side of normal.
Percent of cloudy mornings (>4 Octas) remains stable at a very high positive anomaly. For a calendar month that had 35% cloudy mornings in the reference decade beginning in 1999, it now has 55% cloudy mornings.
Note: Fully smoothed data – Gaussian smoothing with half-width 6 months – are plotted in red, partly smoothed data uncoloured, and raw data for the last data point in orange. January data points are marked by squares. Blue diamonds and the dashed blue rectangle show the extreme values in the fully smoothed data record since September 1999.
