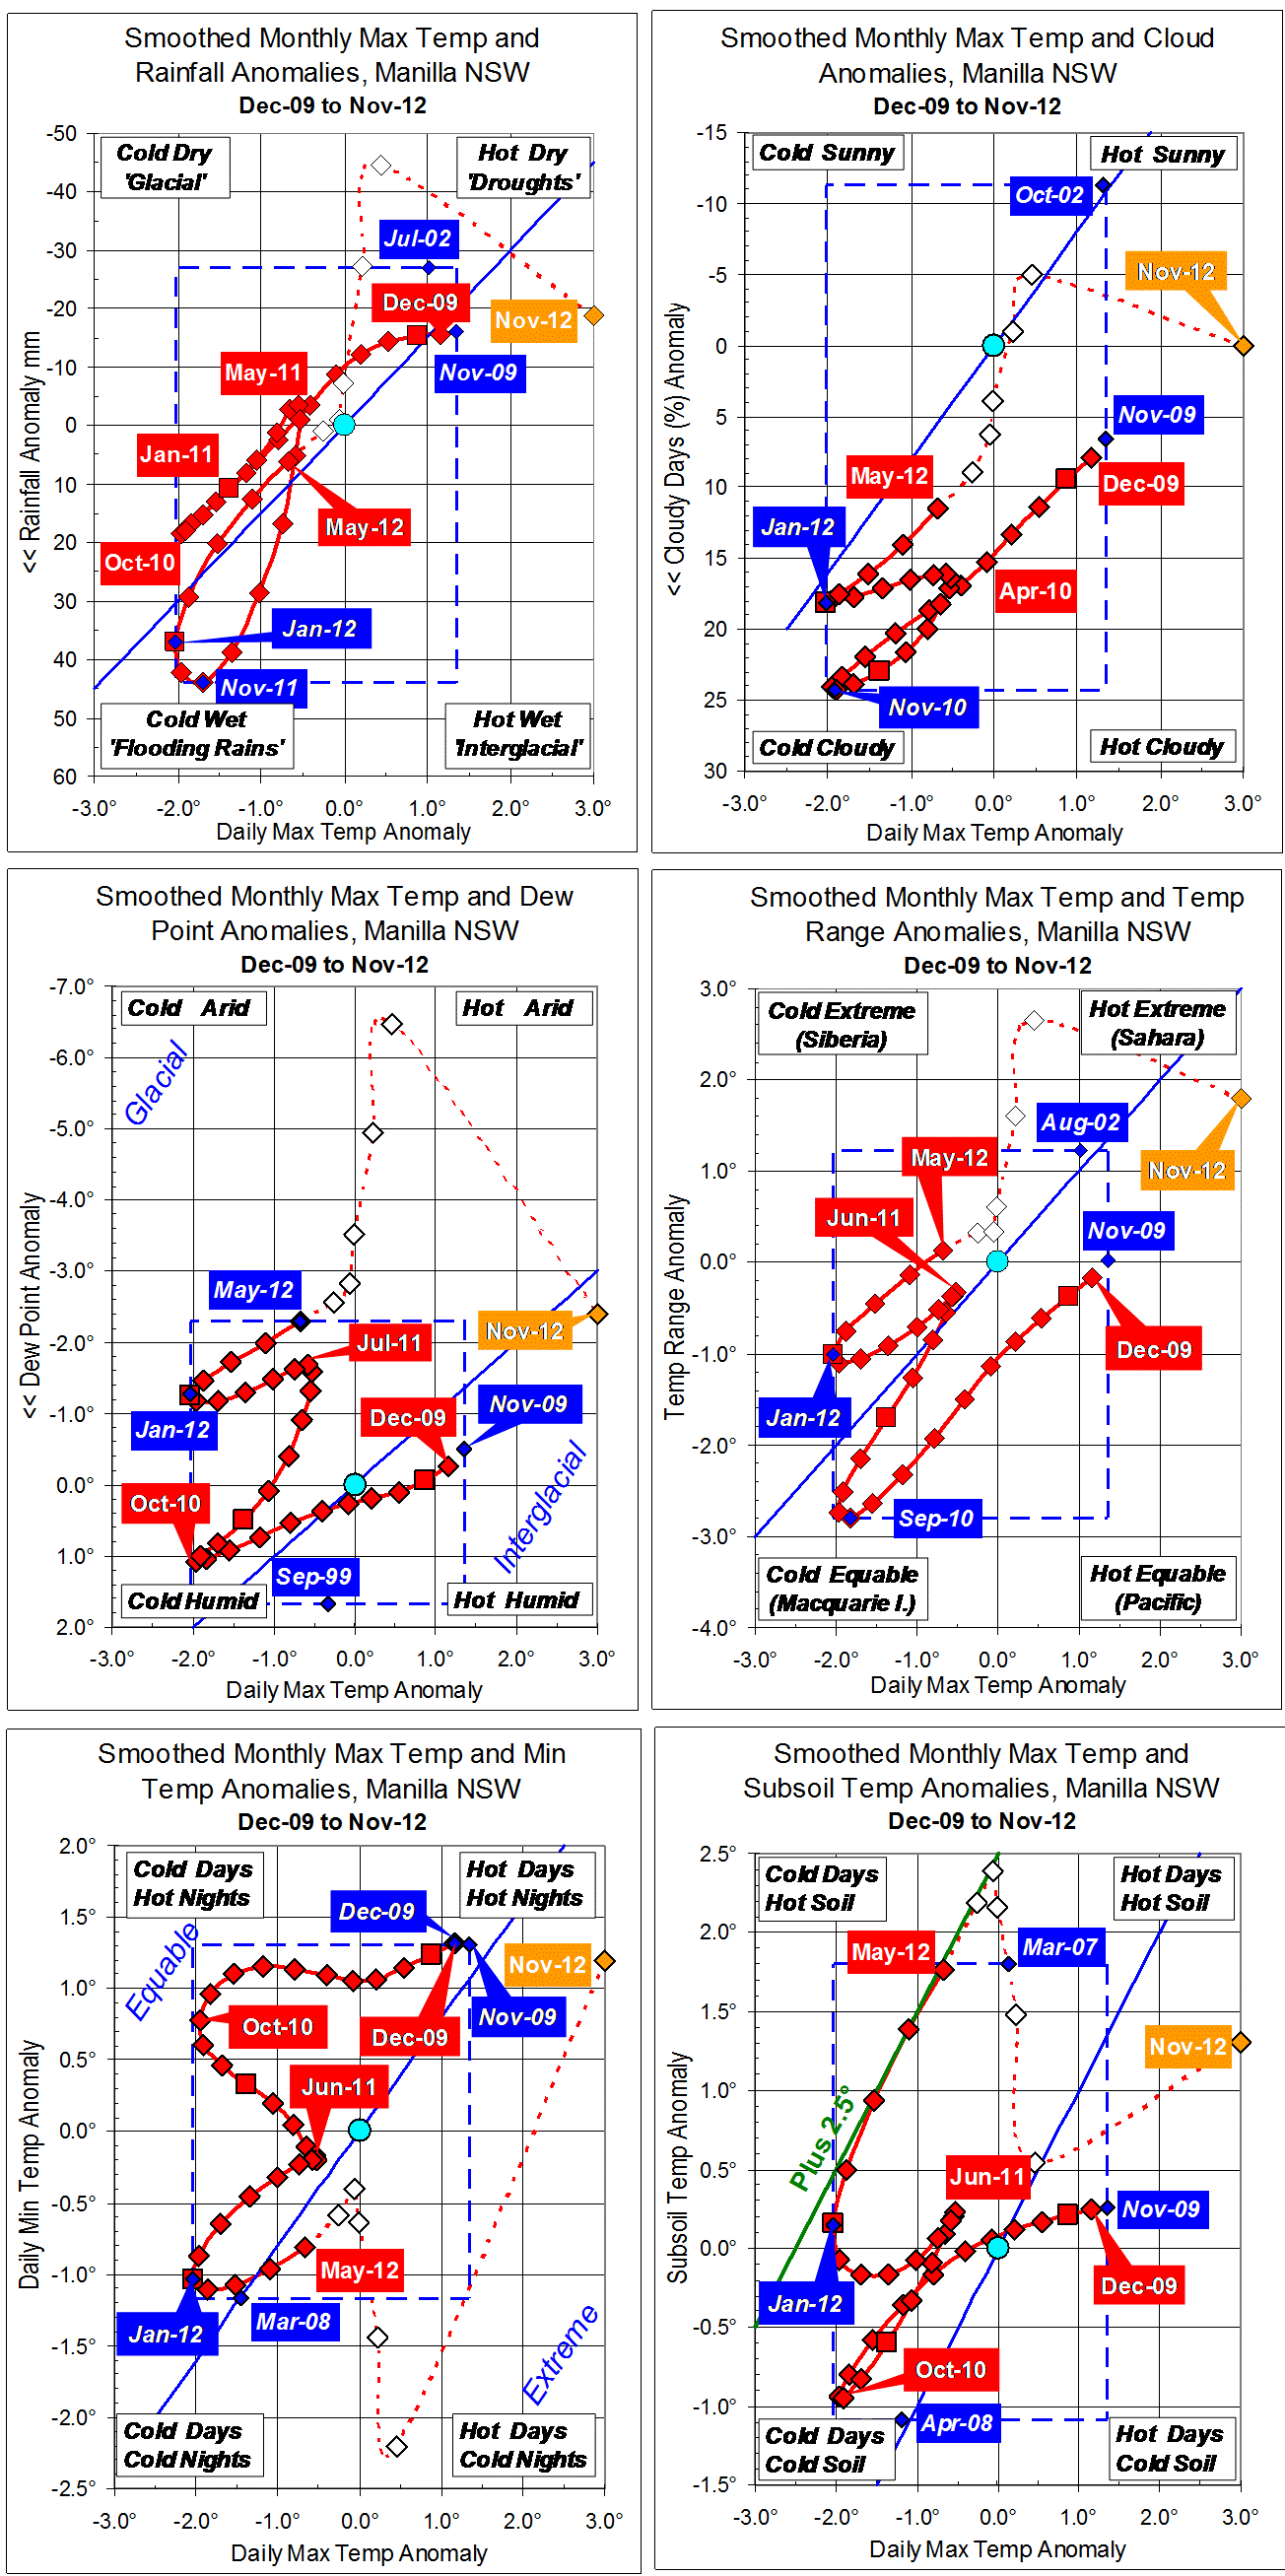
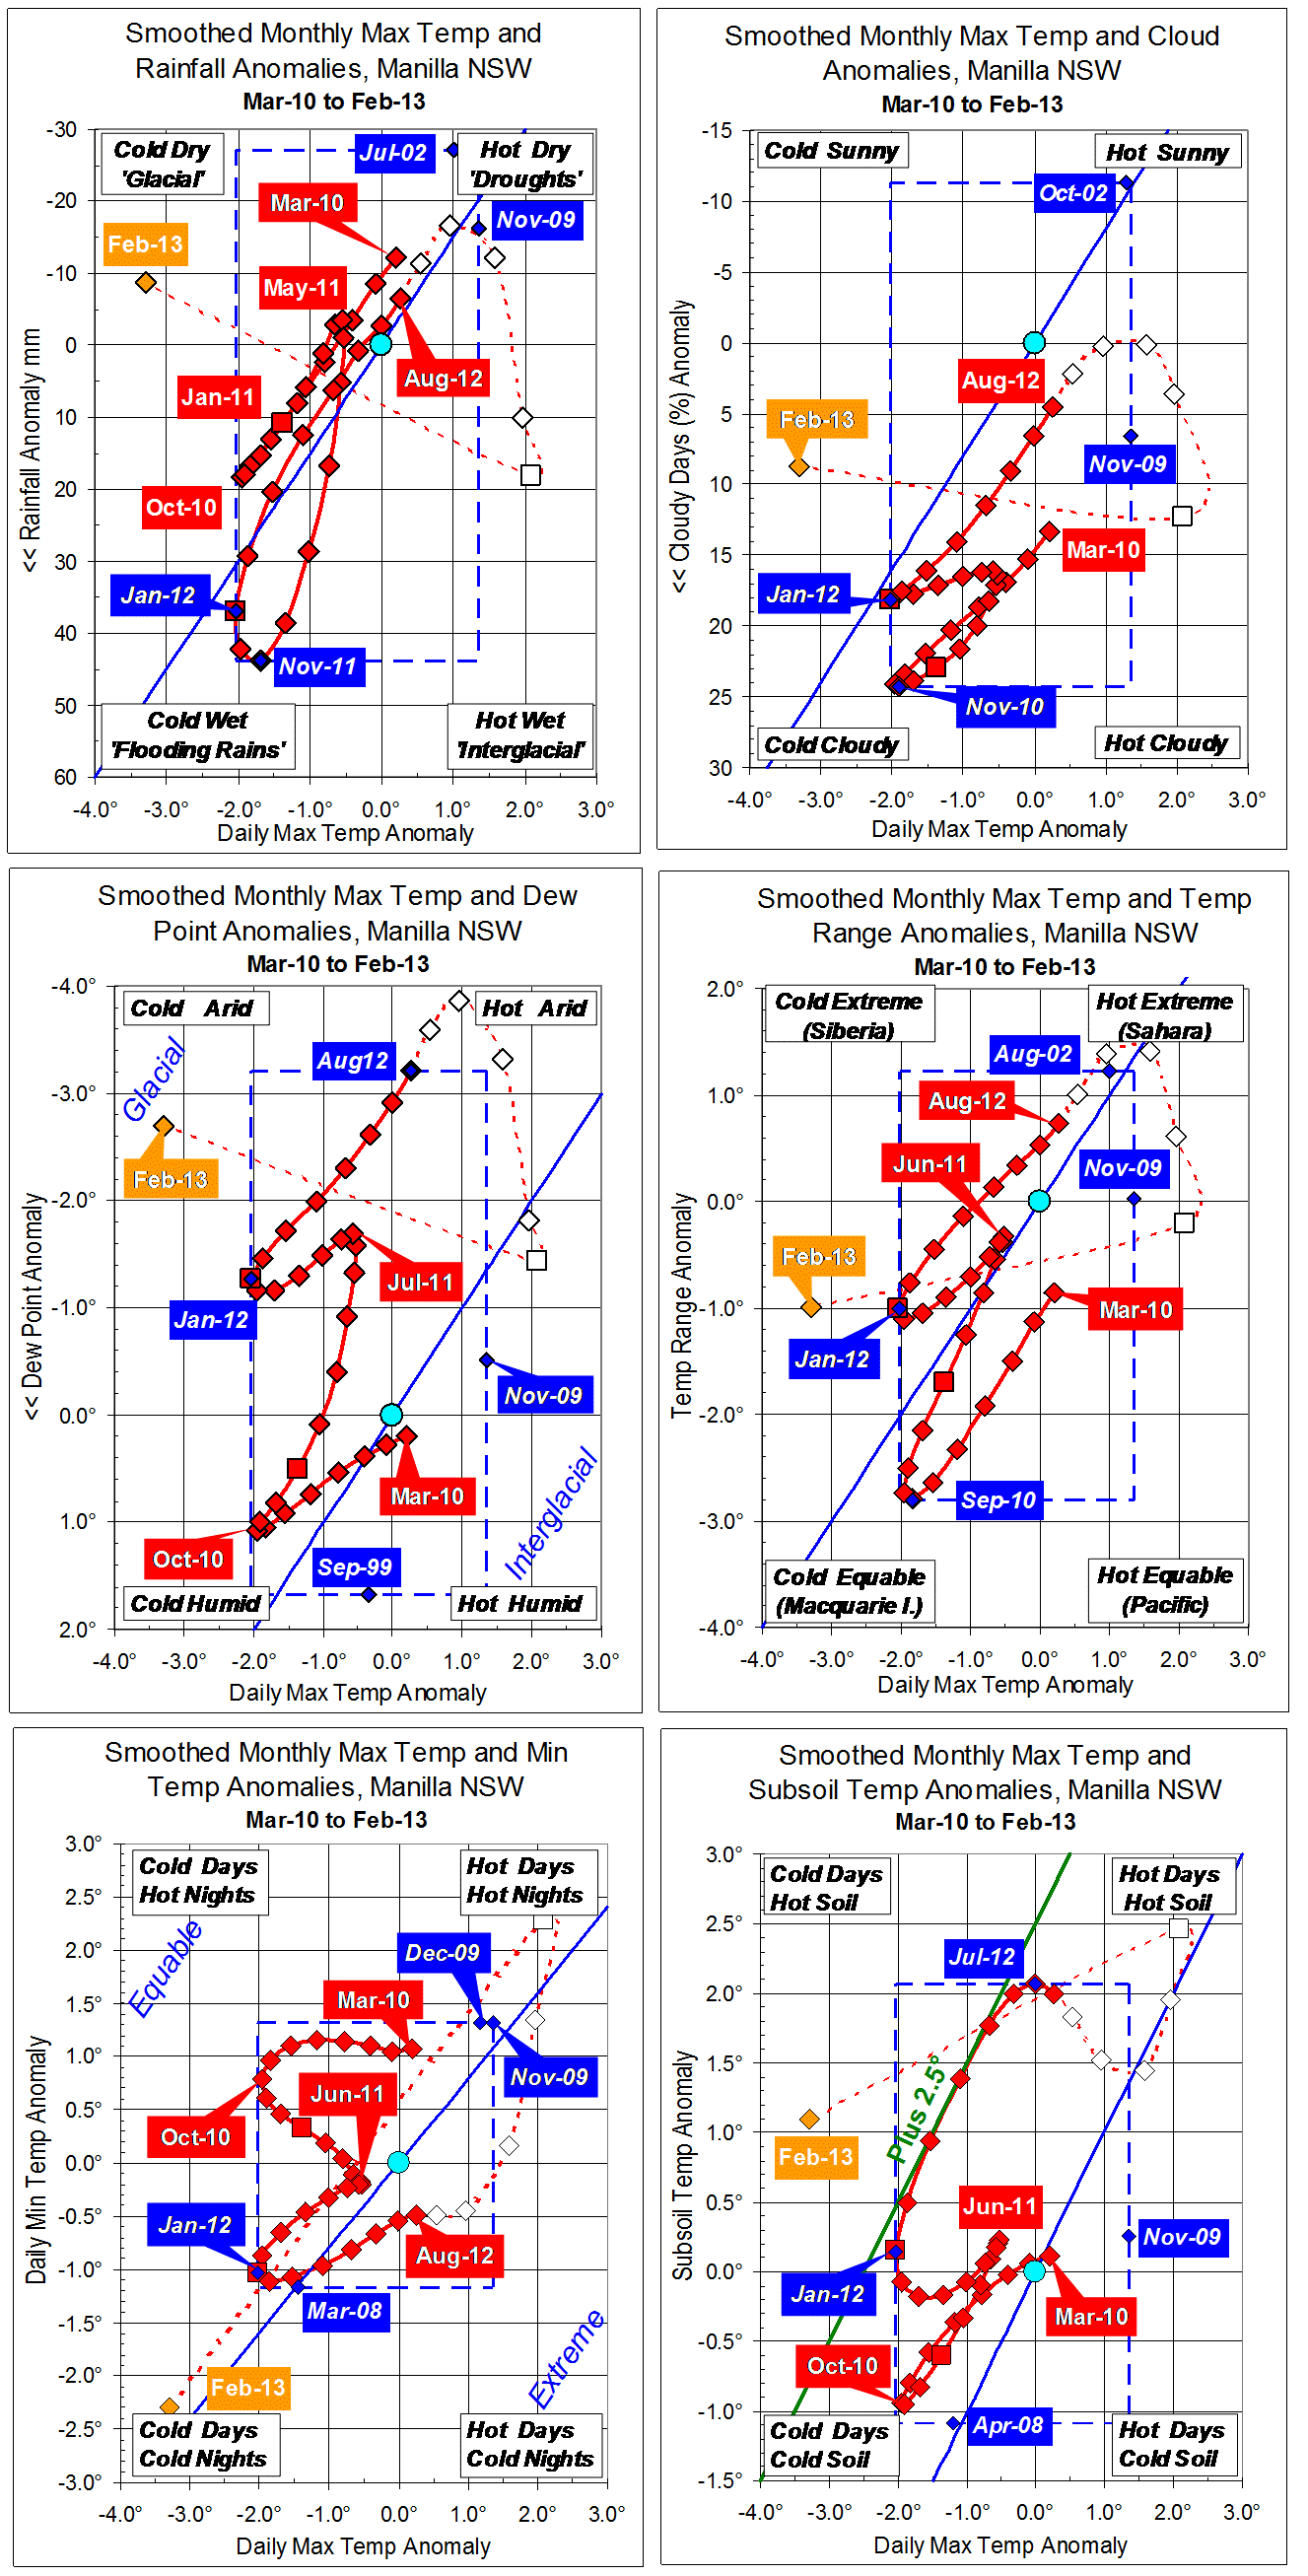
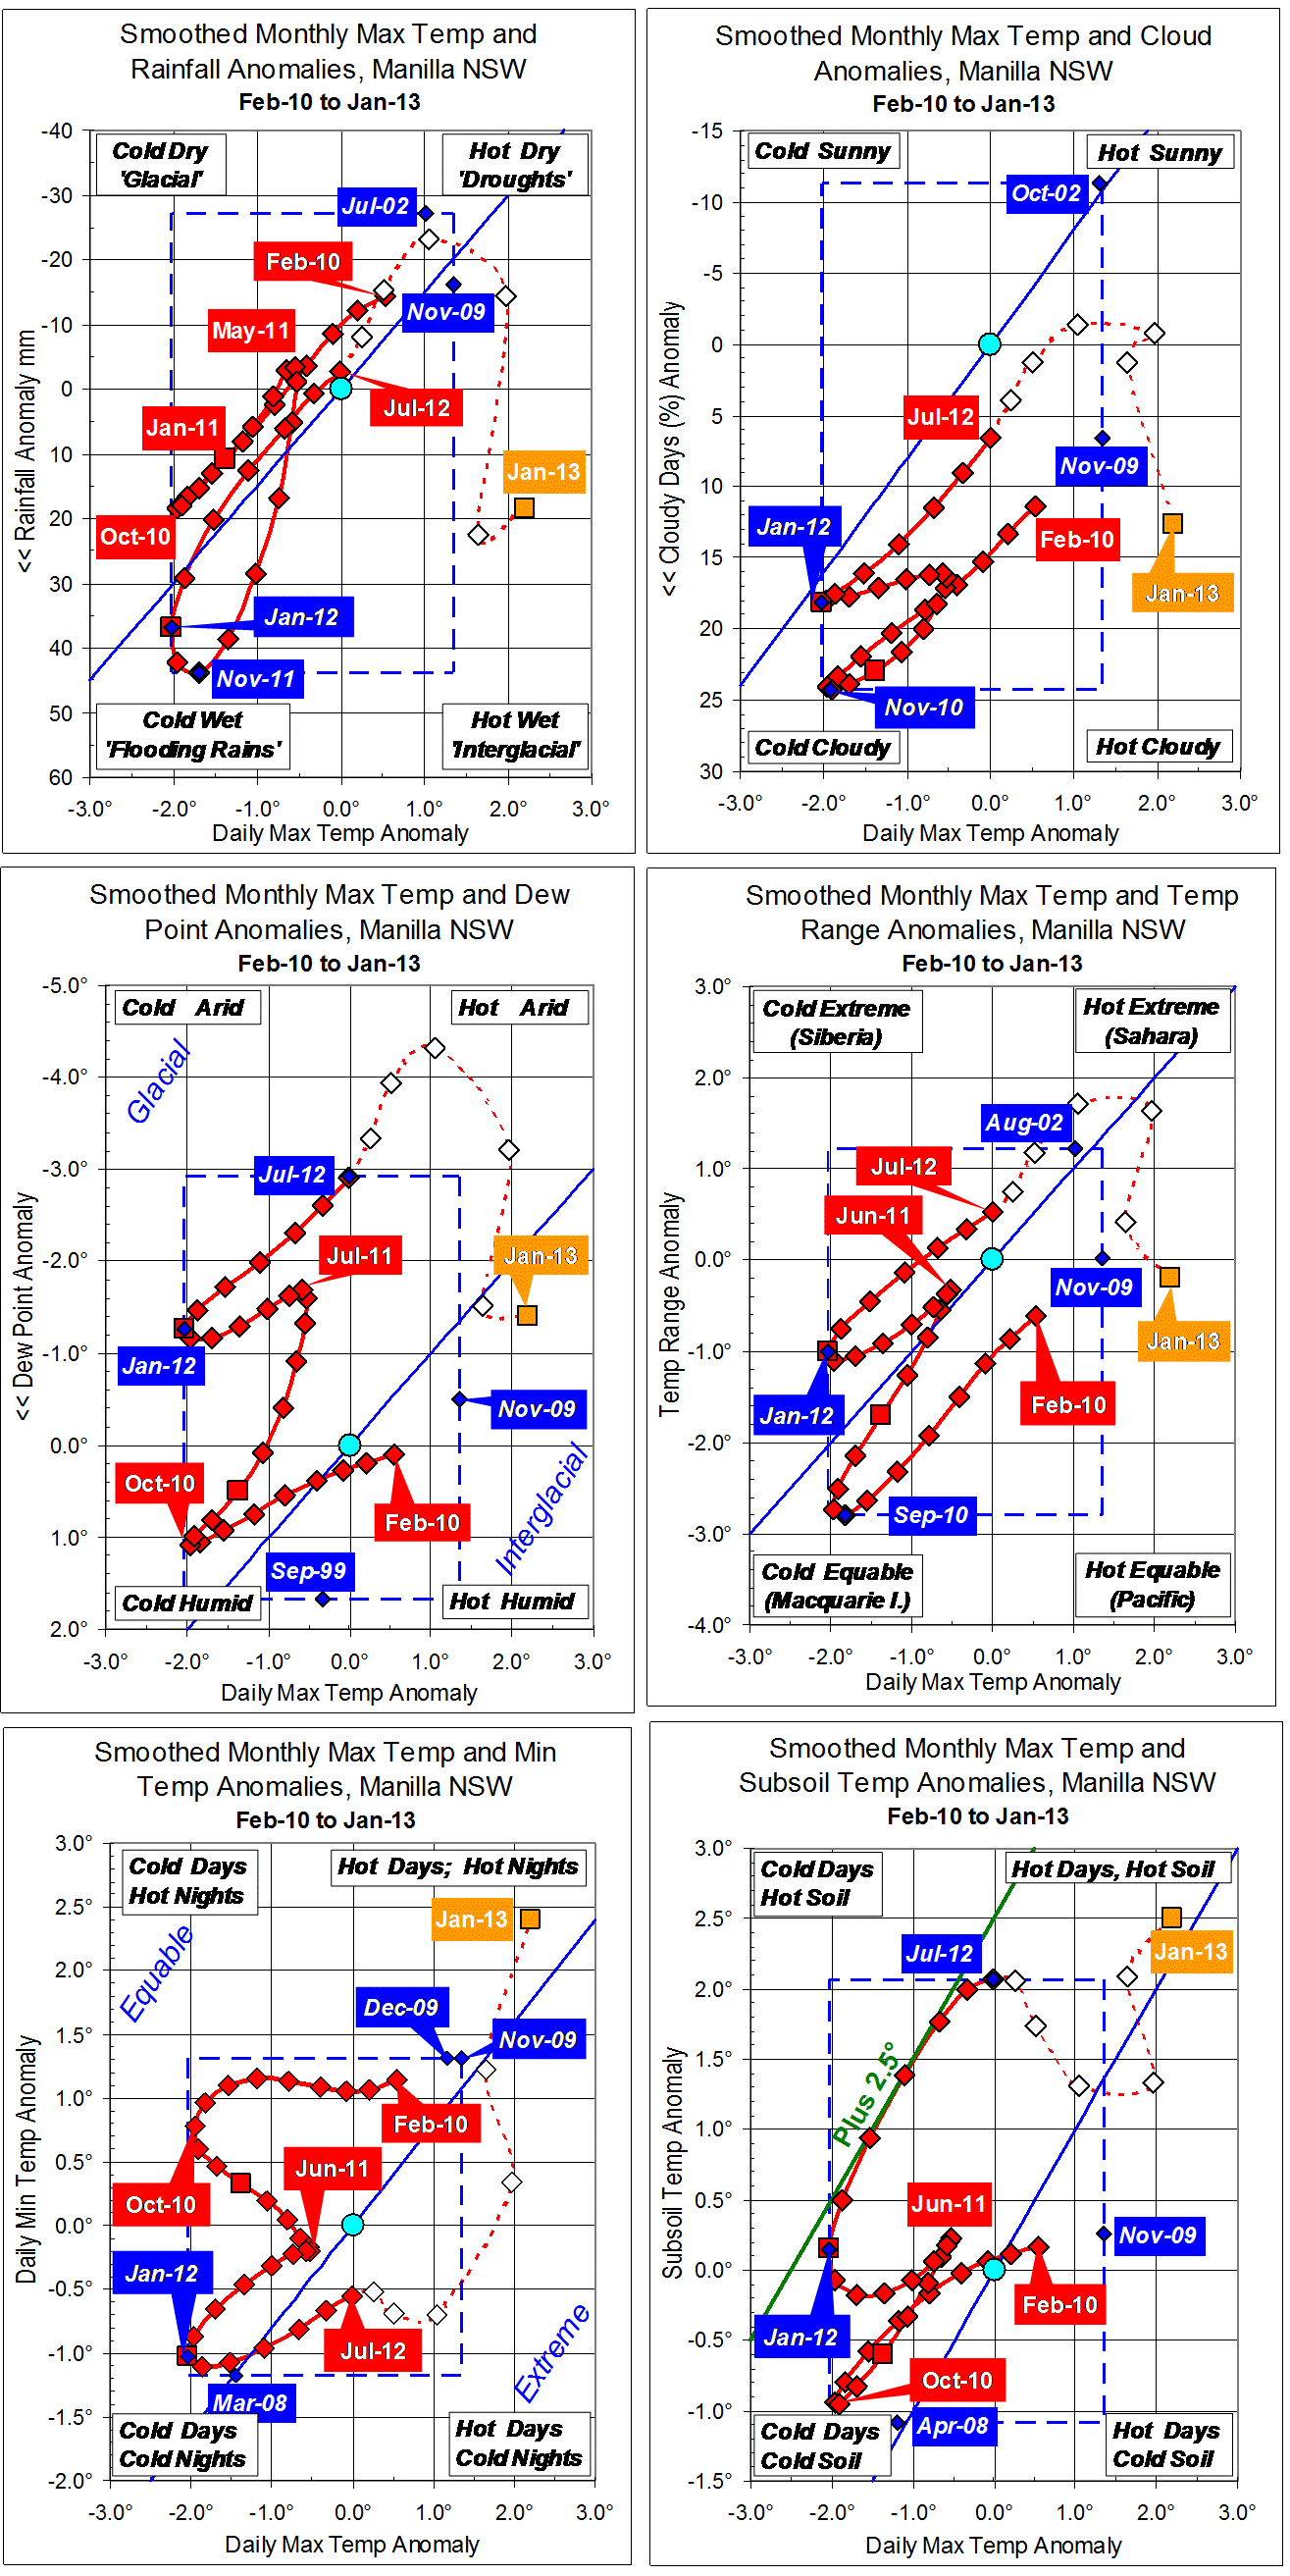
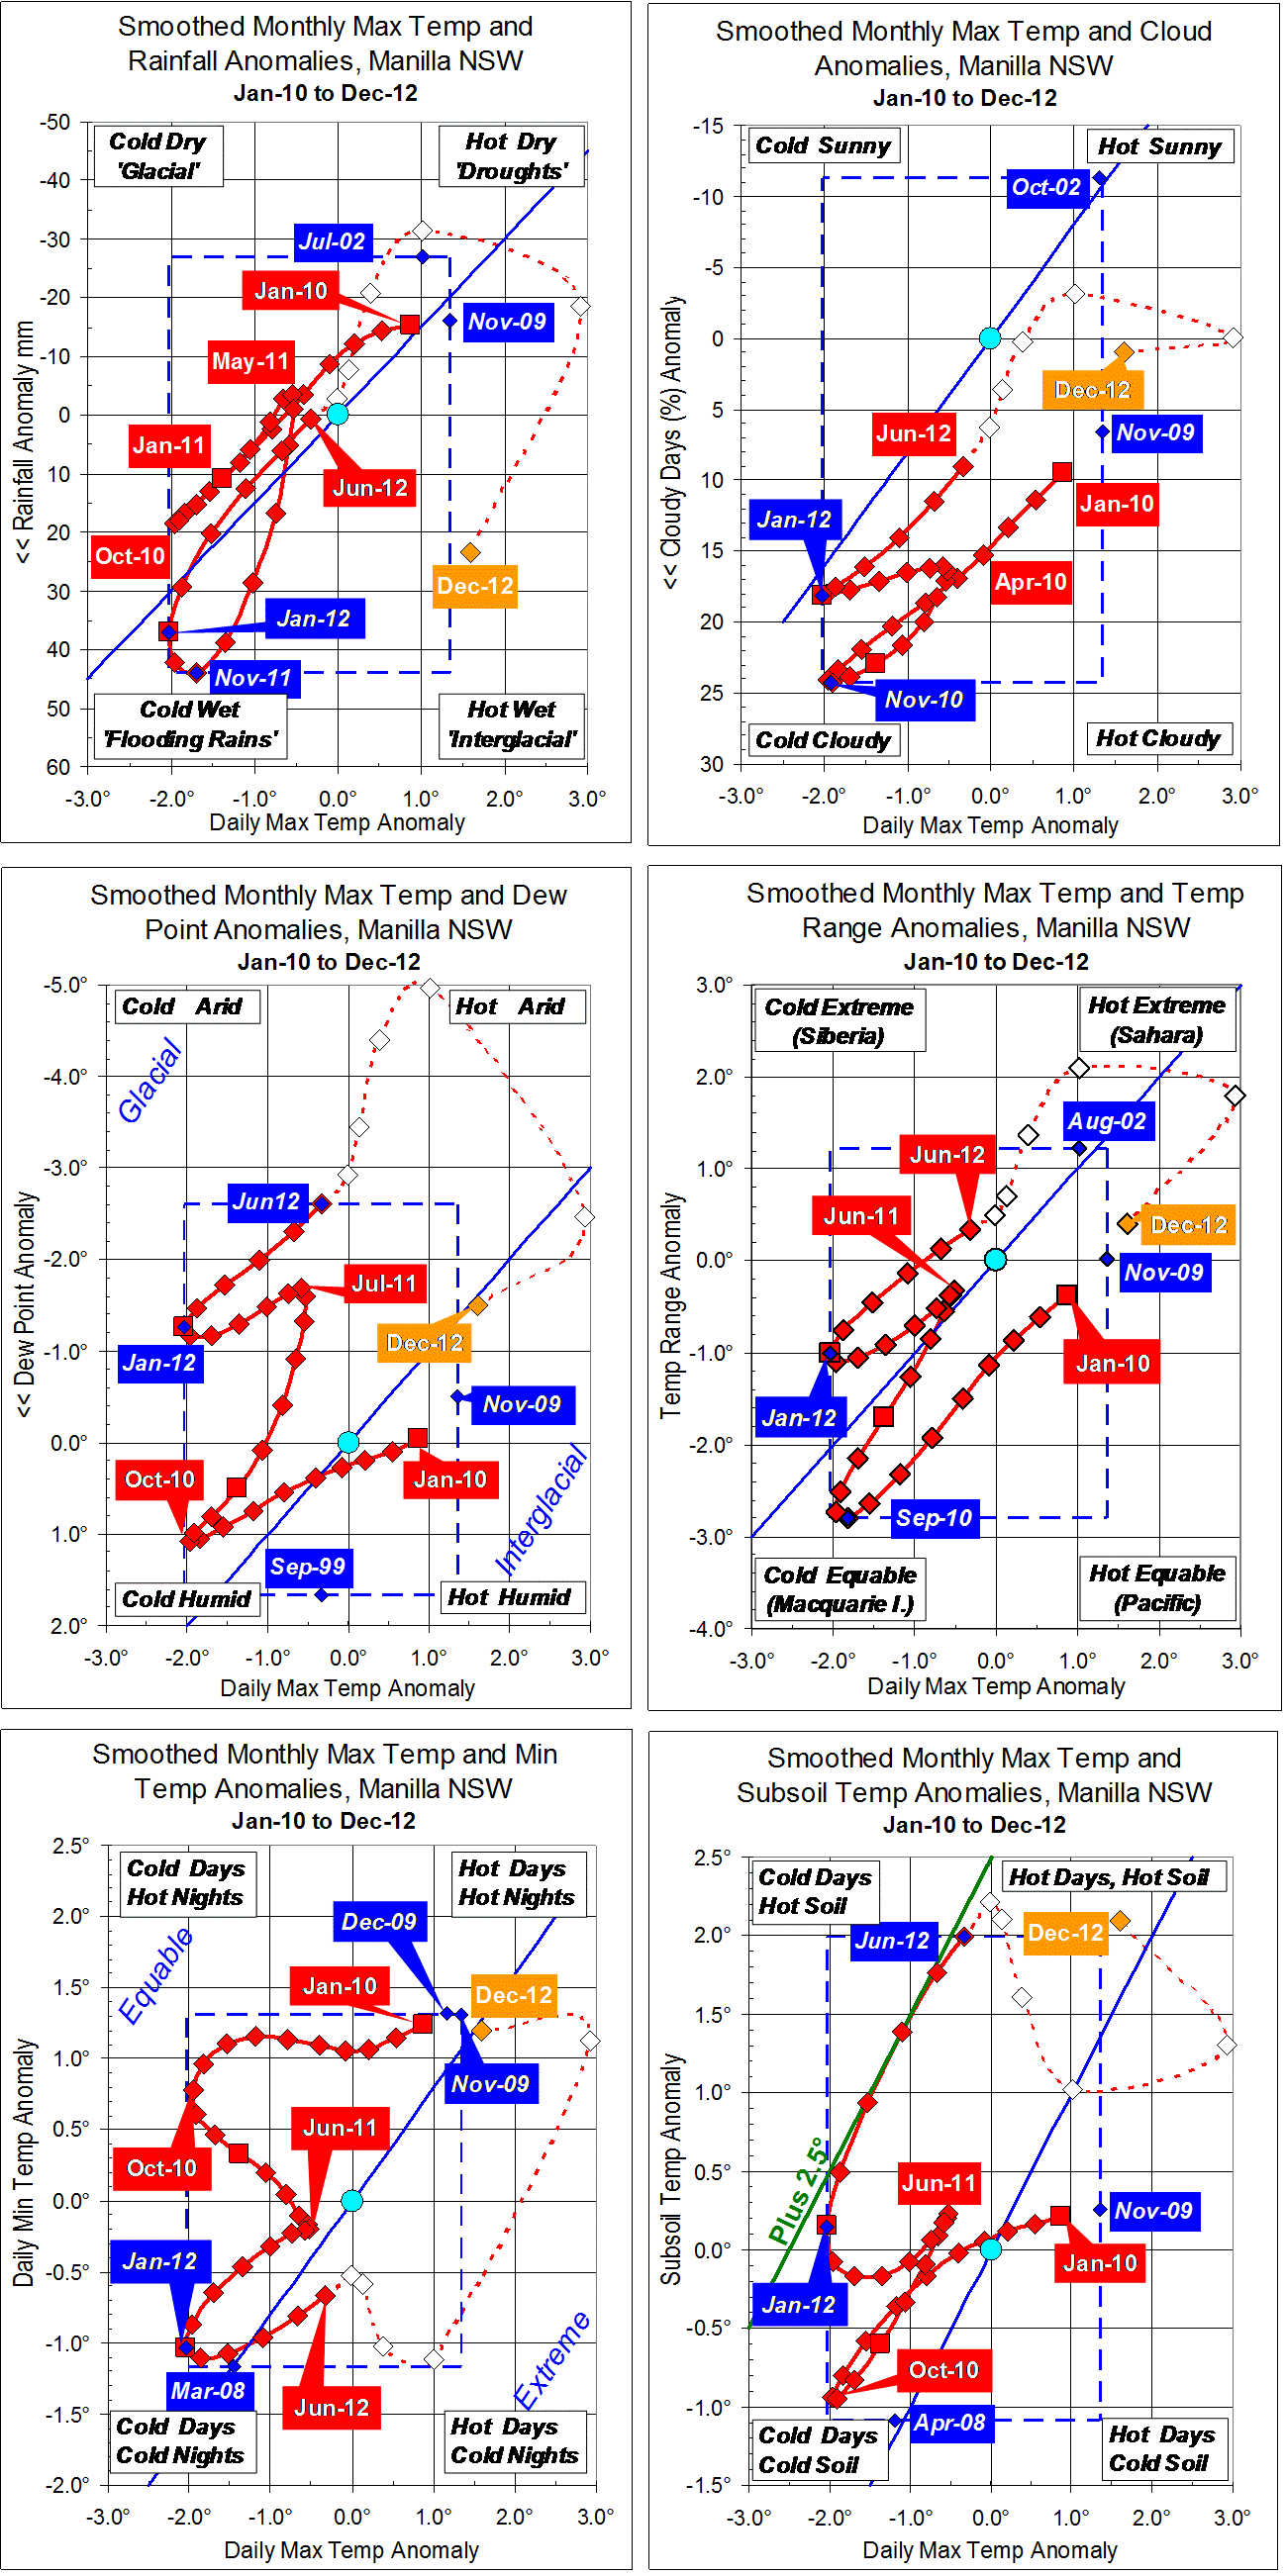
Parametric plots of smoothed climate variables at Manilla
“Suddenly colder”
Temperatures, both max and min, fell from very high in January to very low in February. Daily temperature range and rainfall remained normal. Dew point remained very low, while cloudiness and subsoil temperature remained high.
Winter 2012
Fully-smoothed data (in red) reveal that the trend in winter, as in autumn, was towards “droughts” (top right) for all variables except subsoil temperature (which peaked). Mean values over winter, however, were very different:
* Subsoil temperature: very high;
* Cloudiness and temperature range: rather high;
* Maximum temperature and rainfall: normal;
* Minimum temperature: rather low;
* Dew point: extremely low.
In August, dew point anomaly again reached a new record low: -3.21 degrees.
Note: Fully smoothed data – Gaussian smoothing with half-width 6 months – are plotted in red, partly smoothed data uncoloured, and raw data for the last data point in orange. January data points are marked by squares. Blue diamonds and the dashed blue rectangle show the extreme values in the fully smoothed data record since September 1999.
 Temperatures rose as normal this spring, apart from a quick rise in the last week and a cold spell in the second week of October. In the cold spell, one day failed to reach 14°! Rain fell nearly every week, but never more than 15 mm in a day.