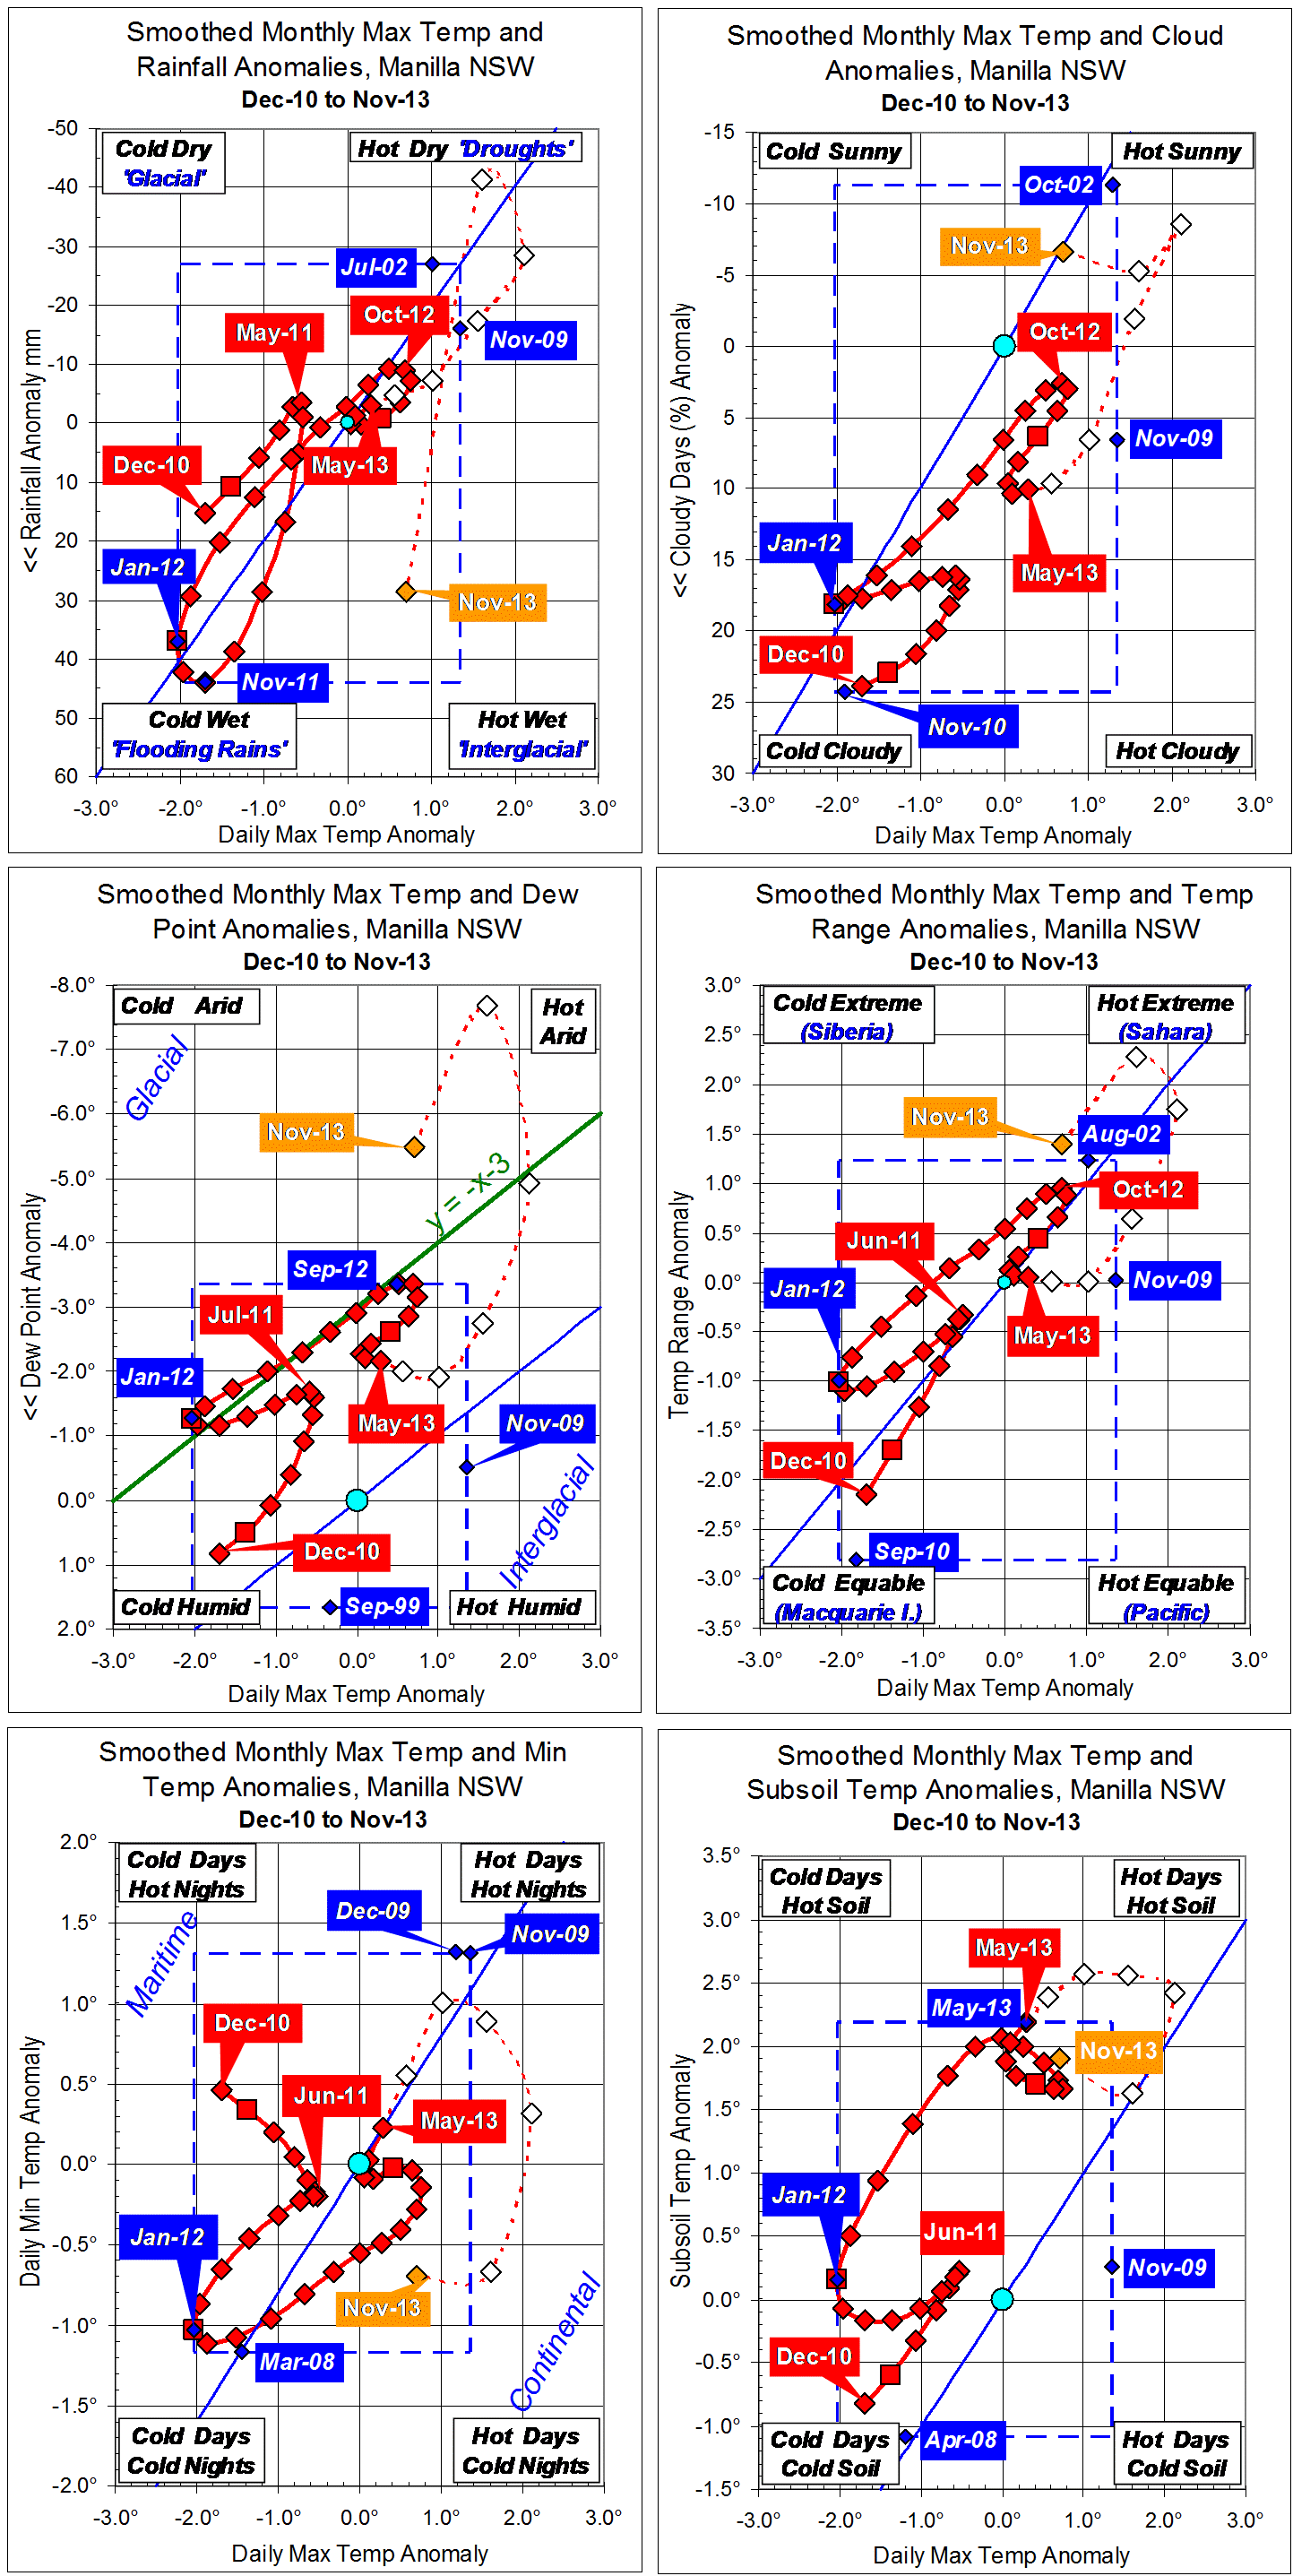
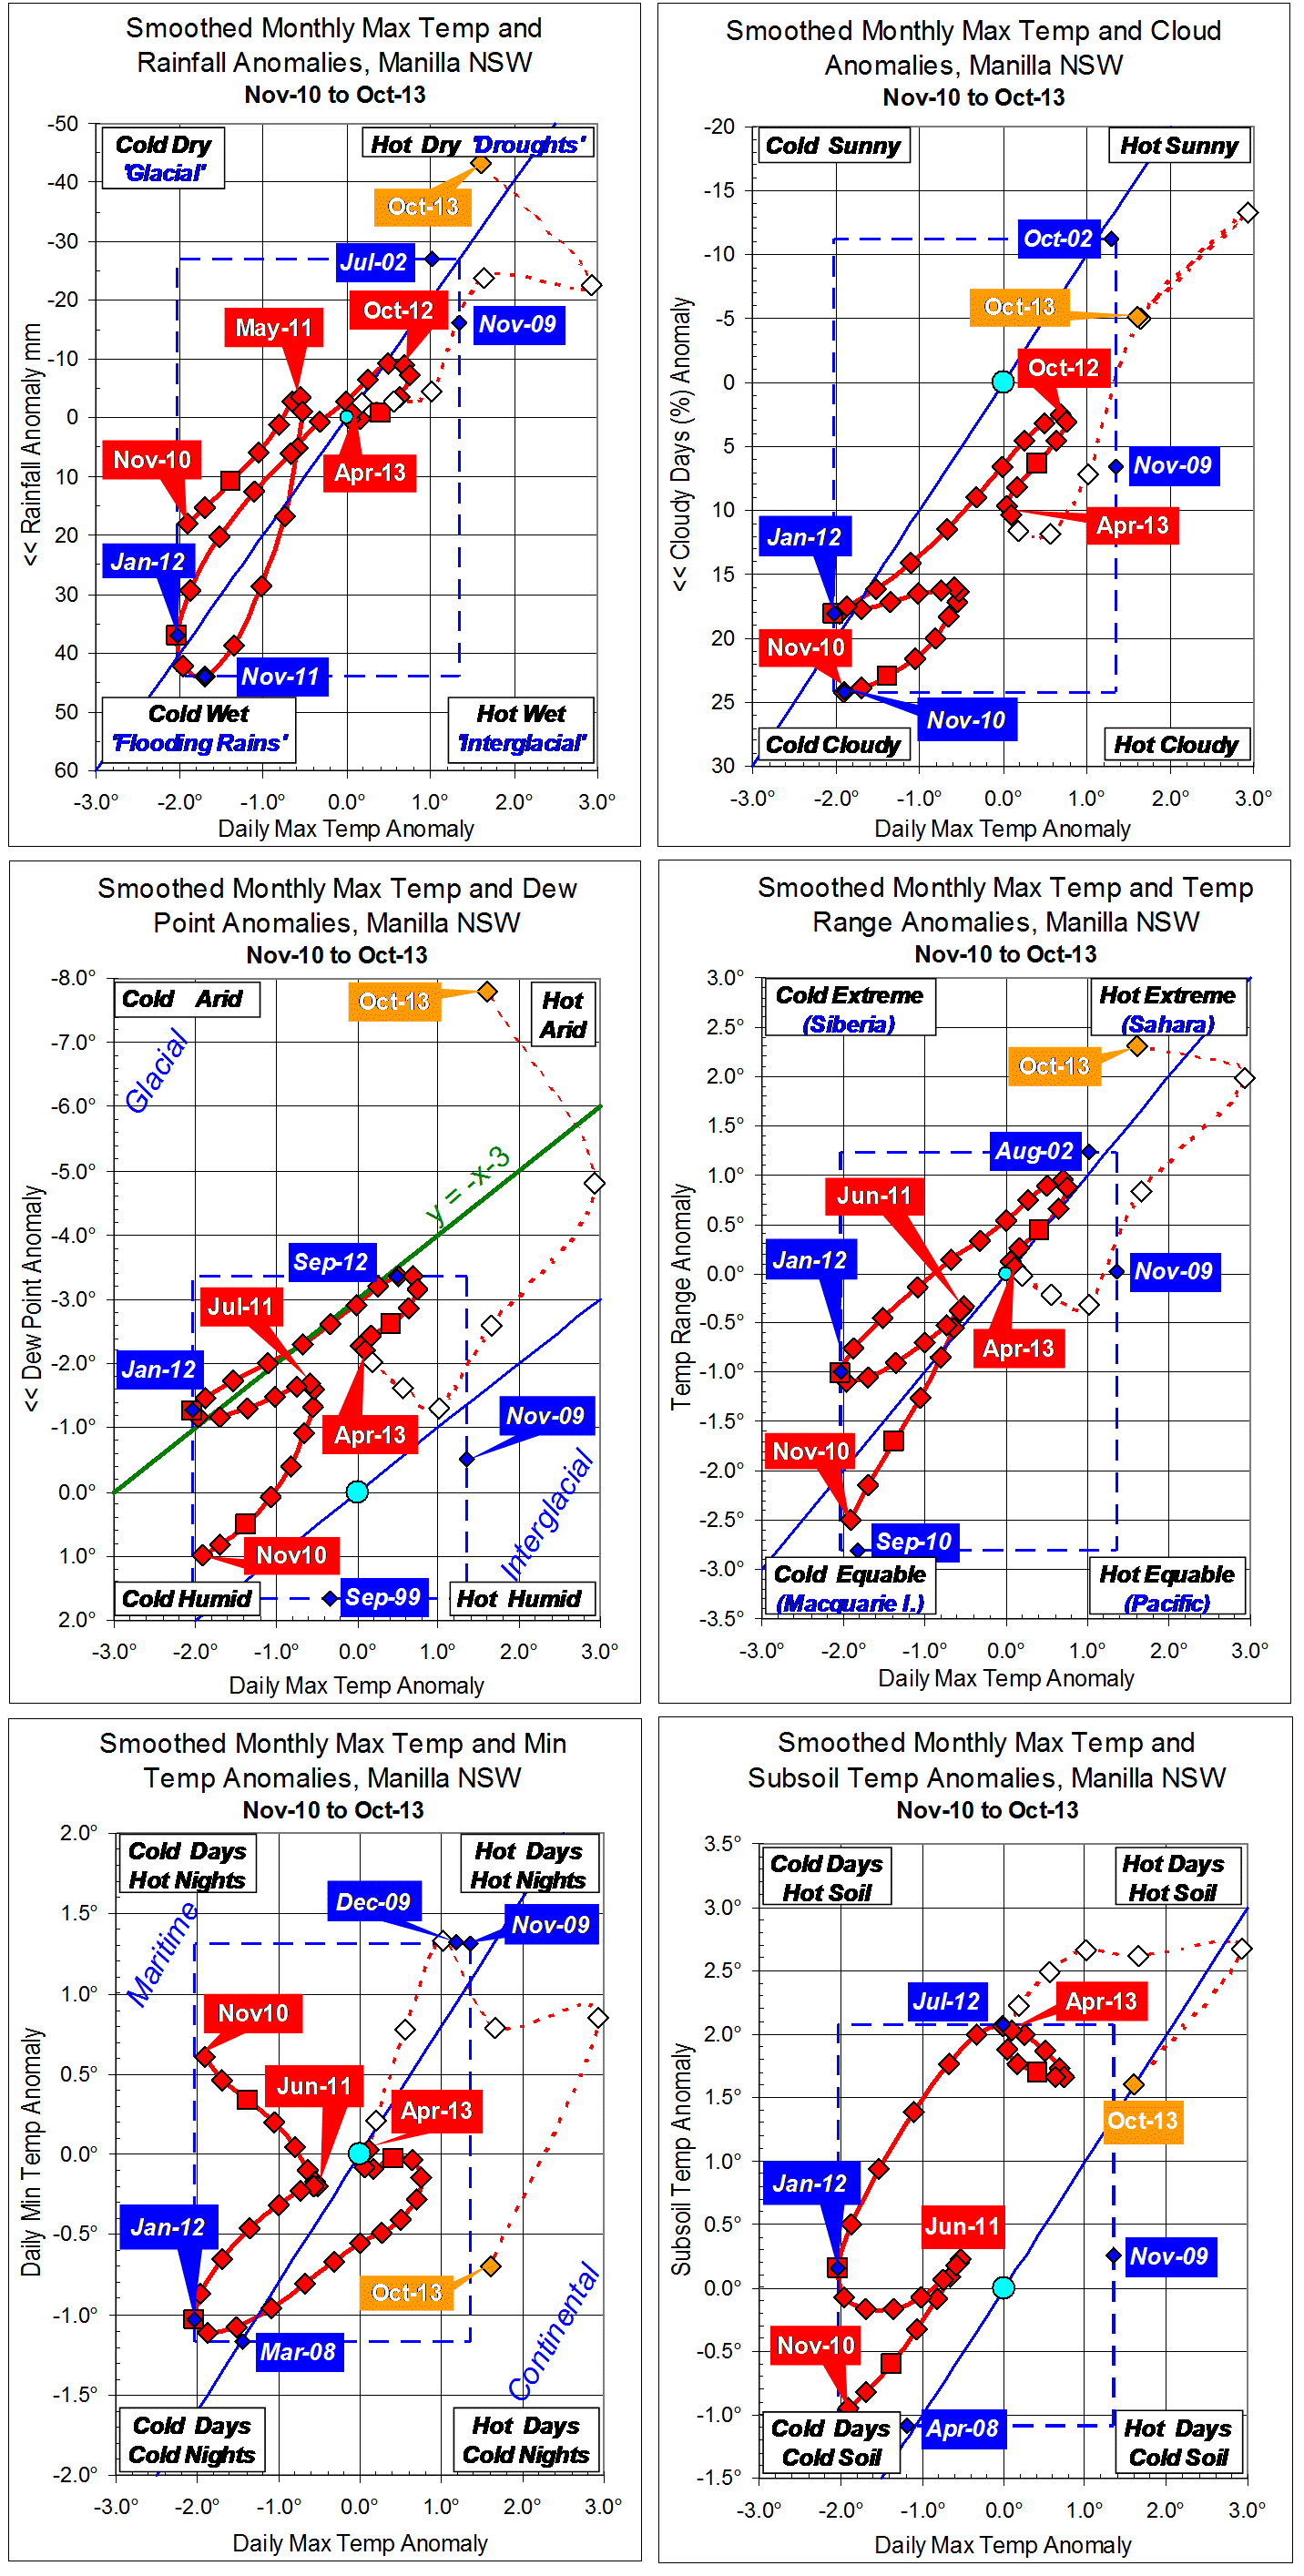
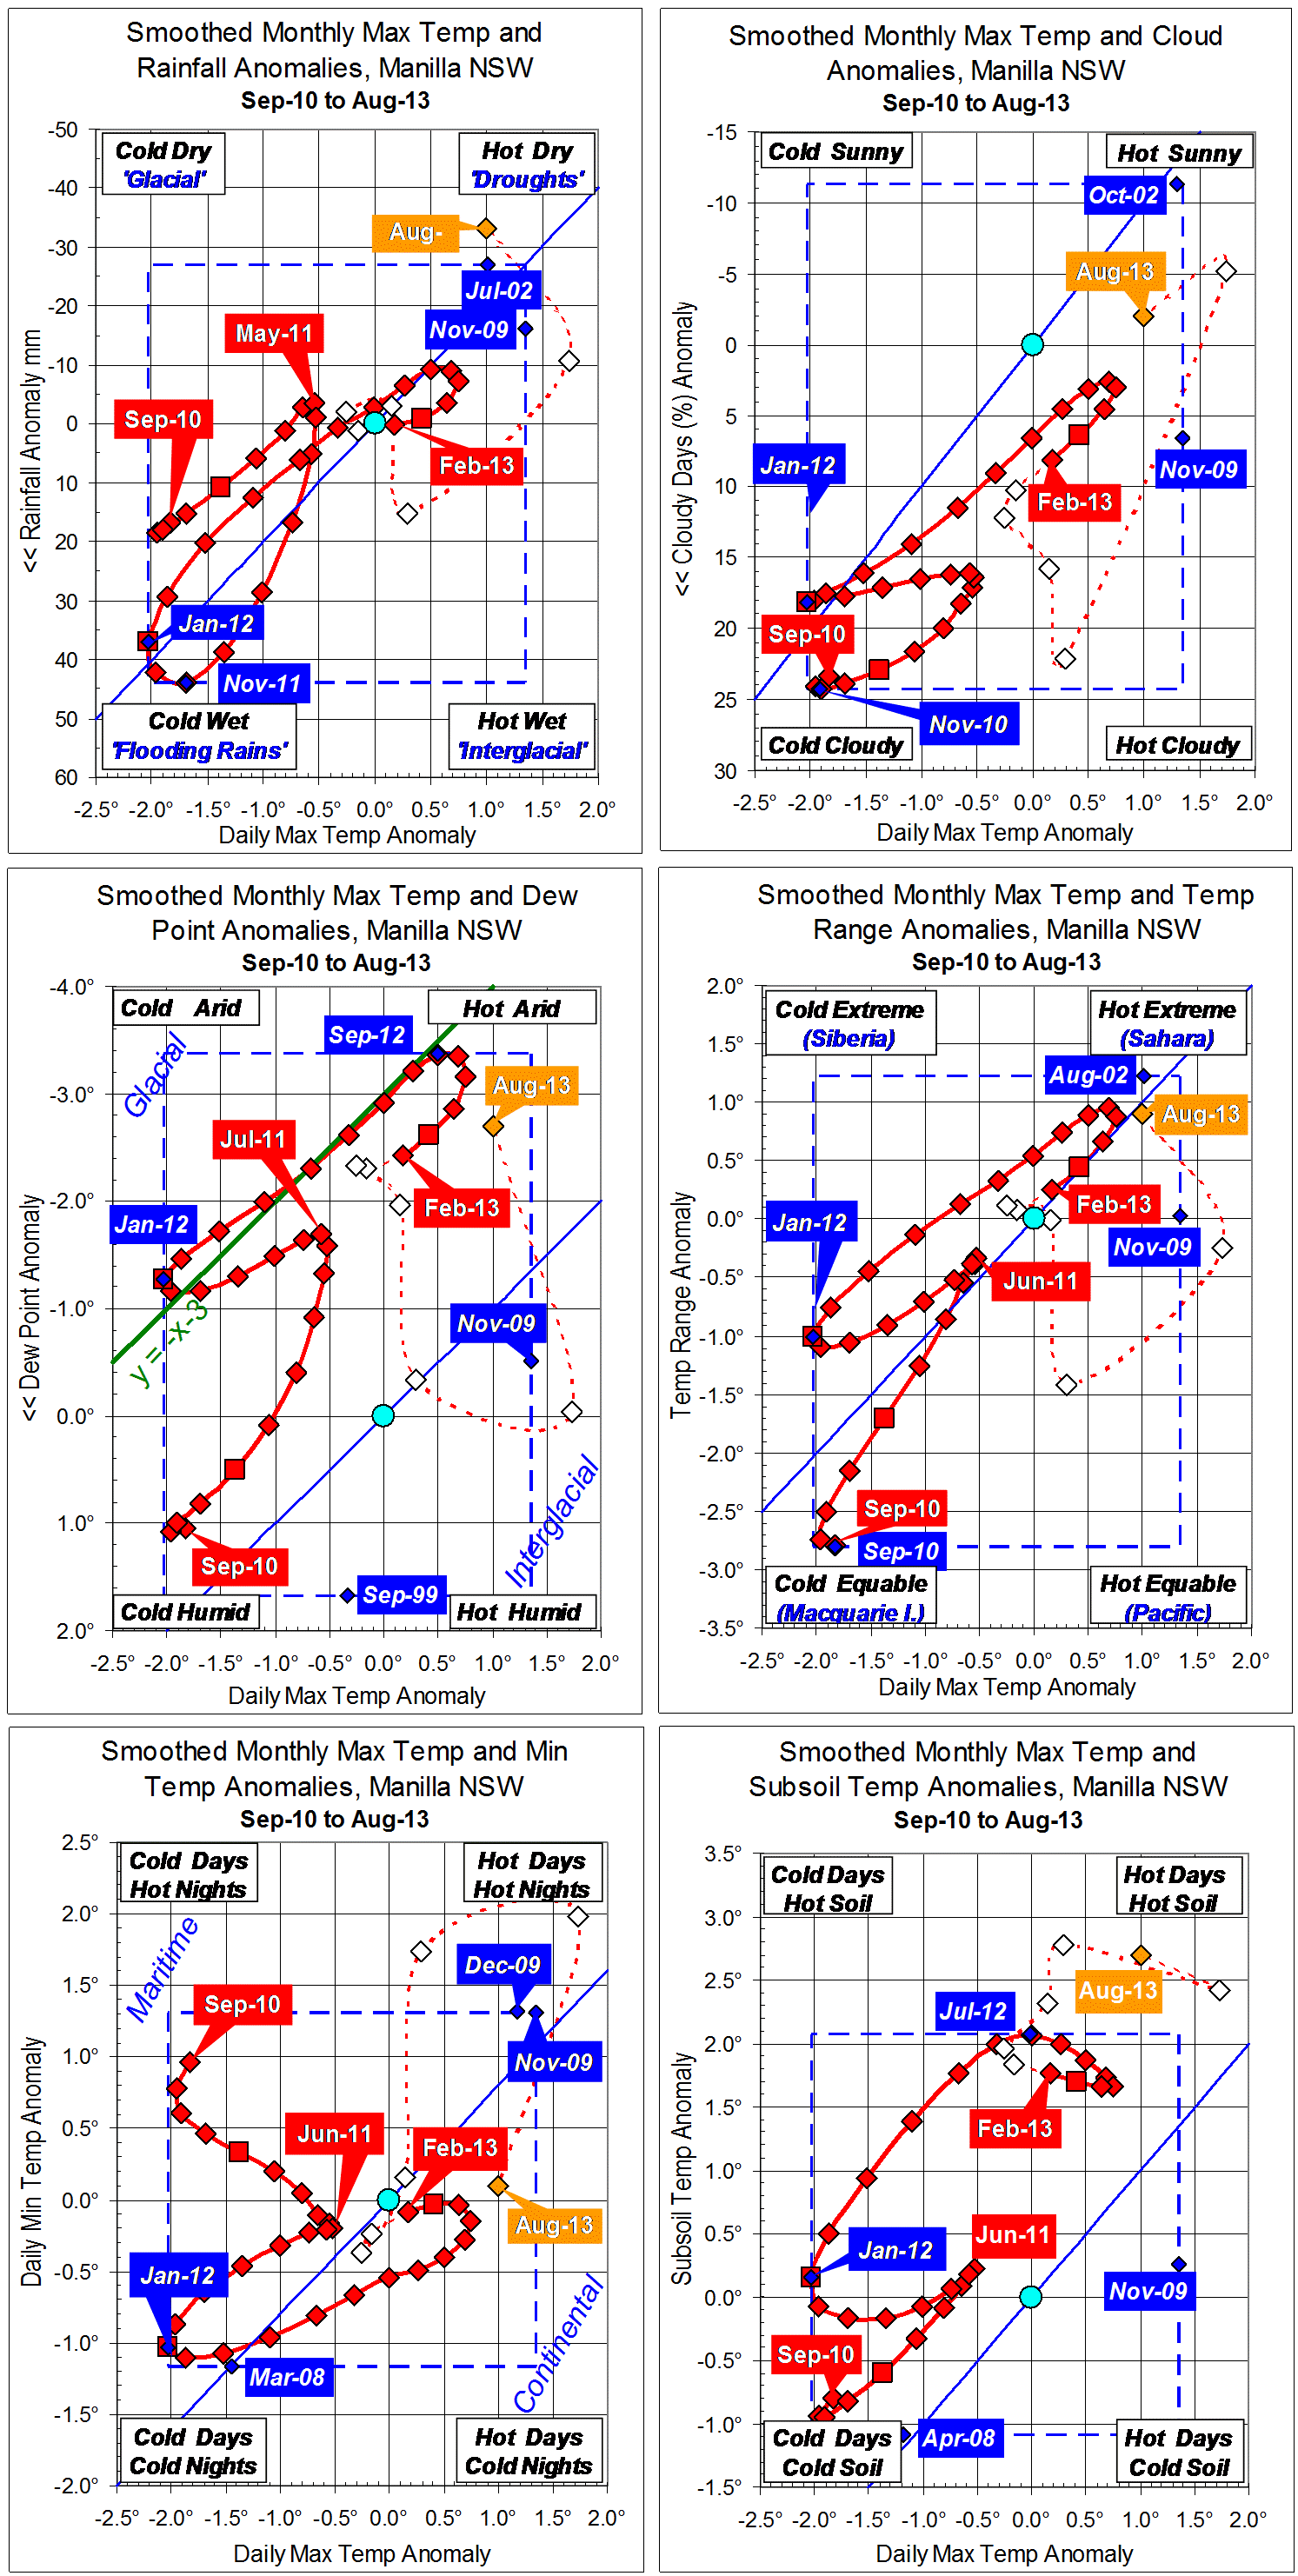
Parametric plots of smoothed climate variables at Manilla
“Still in drought”

Raw anomaly values for climate variables for December 2013 are nearly all in the top right “droughts” corner.
Six months earlier, the fully-smoothed data point for June 2013 also moved towards drought. The value for subsoil anomaly reached a new record of 2.31 degrees.
Note:
Fully smoothed data – Gaussian smoothing with half-width 6 months – are plotted in red, partly smoothed data uncoloured, and raw data for the last data point in orange. January data points are marked by squares.
Blue diamonds and the dashed blue rectangle show the extreme values in the fully smoothed data record since September 1999.