September 2017 even more arid

Trellised vine photo

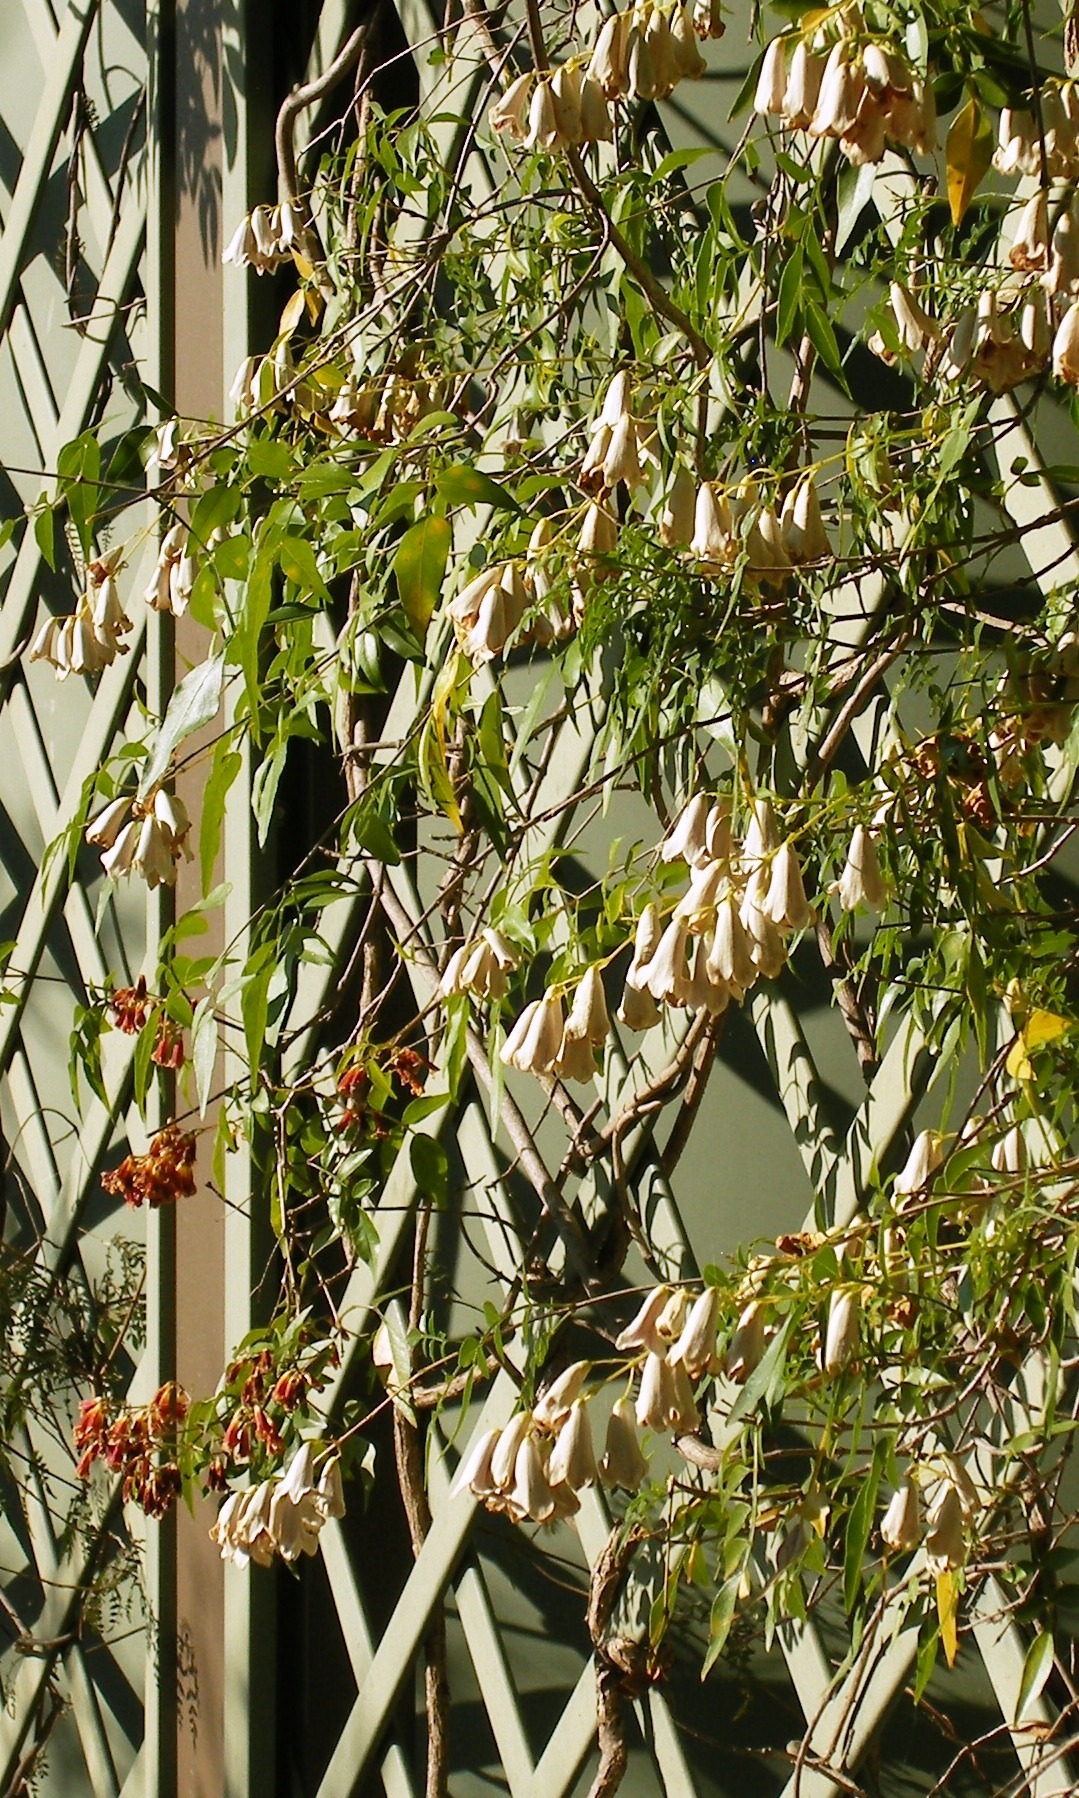
Blooming Wonga-Wonga Vines

Despite more cloud, September was even more arid than August. Weekly temperatures remained normal until the last week, which was remarkably warm. There were some notable events. The 13th, the first 30°-day of the season, was followed by a day more than 16° cooler. Extremely low humidity early on the 20th made the dew point (-8.8°) almost as low as the record set last month. Among minimum overnight temperatures that were near zero, the one on the 24th (22.8°) set a record by being 14.7° higher than normal.
The number of frosts (below +2.2° in the screen) was 13 (a September record), almost as many as in August. Perhaps the frost on the 20th was the last of the season. That is the normal date for it.
There was 5.2 mm of rain on the 14th, and an estimated 0.3 mm on the 29th. (The automatic gauge at the Museum was down by then.)

Weather log

Comparing September months

The mean daily maximum of 25.0° was rather high, fully 5° higher than last year. With a mean daily minimum (5.7°) that was rather low, the daily temperature range reached the record wide value of 19.3°.
Extremely dry air was shown by a mean early-morning dew point of 2.7°, the lowest September value, 8.1° below normal.
The total rainfall of 5.5 mm (estimated) was very far below the September average (41 mm), at the 8th percentile. That is a serious rainfall shortage. The current rainfall totals for four months (95 mm) and for six months (175 mm) are also serious rainfall shortages. Even worse are the totals for two months (19 mm) and for three months (33 mm): they are severe rainfall shortages.
Similar severe shortages occurred in October 2013, May 2008, and May 2005. Extreme shortages last occurred in the six-month drought of 2002.

Climate graph for September


Data. A Bureau of Meteorology automatic rain gauge operates in the museum yard. From 17 March 2017, 9 am daily readings are published as Manilla Museum, Station 55312.  These reports use that rainfall data when it is available.  The gauge last reported on 24 September 2017.

All other data, including subsoil at 750 mm, are from 3 Monash Street, Manilla.

A drought has begun

A year ago, I showed that Manilla was far from being in a drought. That is not true now. There are severe shortages of rain.

Rainfall status at Manilla, September 2016 and September 2017.

The first graph has rainfall totals up the left margin. They are not expressed in millimetres but as percentile values, Along the bottom margin is the number of months included in calculating each rainfall total.

On the graph, I have compared the rainfall situation today, September 2017, plotted in red with that of September 2016, plotted in grey. Much has changed.

Take, for example, the 12-month (one-year) rainfall total. Rainfall totals for 12 month periods are directly above the value “12” at the bottom of the graph, near the label “Number of Months included”. In data for the month of September 2016 (grey), the 12-month total (actually 802 mm) had been at the 80th percentile, which was very high. In up-to-date data for the month of September 2017 (red), the 12-month total (actually 484 mm) is at the 17th percentile, which is very low.
Although rainfall totals for  periods longer than 12 months have not fallen so much, nearly all of them have fallen. Three that have not are those for 30 months, 36 months and 42 months. They were already low, due to including in them some months of low rainfall several years ago, in 2013 and 2014.

So far, real shortages have occurred mainly within the last 12 months. Beyond that, the two-year rainfall total of 1285 mm, for example, is still near normal, plotting at the 48th percentile.

The second graph shows in detail how shortages that are serious or severe have developed during the last six months. These were the monthly rainfall amounts, with the normal amounts in brackets:

April: 24.0 mm (39.3);
May: 55.6 mm (40.3);
June: 62.8 mm (44.3);
July: 13.2 mm (41.4);
August: 13.8 mm (39.5);
September: 5.5 mm (41.2).

As a result, the current situation is as shown below. There are already severe rainfall shortages, at the 2nd or 3rd percentile, in the two-month and three-month totals to date. There are also serious shortages, at the 8th and 9th percentiles, in the four-month and six-month totals to date.

Drought status at Manilla in September 2017

I will update these graphs each month to show how the situation changes.

[Monthly updates were not posted because serious rainfall shortages did not occur in any following months up to March 2018. The next post with a graph and analysis like this one was “Rainfall Shortages up to May 2018” of 15/6/2018.]

[This 2018-19 drought became the worst ever experienced at Manilla. Records for the lowest-ever rainfall totals were broken repeatedly. See, for example (June 2019)  “June breaks more drought records”.]

3-year trends to September 2017

More arid

3-year climate trends to September 2017

September raw anomaly data (orange)

In September 2017 all moisture indicators except cloudiness showed even greater aridity (high up on the graphs) than in August. Daily maximum temperature anomaly (x-axis in all graphs) had now risen very high, but that of the subsoil (lower right graph) had fallen. Daily minimum temperature anomaly (lower left graph) remained extremely low.

 Fully smoothed data (red)

The latest fully-smoothed data point is that for March 2017.
At that time, the climate was warm and almost static, after a minor peak in aridity. Although later anomaly values (only partially smoothed) are subject to noise, three of them have raced away towards aridity: dew point fell, daily temperature range rose, and daily minimum temperature fell.


Note:

Fully smoothed data – Gaussian smoothing with half-width 6 months – are plotted in red, partly smoothed data uncoloured, and raw data for the last data point in orange. January data points are marked by squares.
Blue diamonds and the dashed blue rectangle show the extreme values in the fully smoothed data record since September 1999.

Normal values are based on averages for the decade from March 1999.* They appear on these graphs as a turquoise (turquoise) circle at the origin (0,0). A range of anomalies called “normal” is shown by a dashed rectangle in aqua (aqua). For values in degrees, the assigned normal range is +/-0.7°; for cloudiness, +/-7%; for monthly rainfall, +/-14 mm.

 * Normal values for rainfall are based on averages for the 125 years beginning 1883.

Dry Air in Winter 2017

Photo of red Eucalyptus flowers

Eucalyptus leucoxylon in winter

This winter had remarkably dry air. The lowest early morning dew point was -10.0°, and the winter mean was -0.5°. Both were record low values. Through the season, the dew point got further and further below the early morning temperature, ending five degrees lower.

Daily maximum and minimum temperatures were near normal. However, they were more than a degree cooler than in the recent winters of 2009 and 2013.

Graphical log for winter 2017

With dry air came a wide daily temperature range of 16.3°, second only to 17.5° in the winter of 2002. It also brought sunny weather, with only 32% cloudy mornings. While that was near the average for my “normal” decade 1999-2008, it was lower than in any recent winter. The winters of the last decade, 2007-2016, were much more cloudy, averaging 45% cloudy mornings. Winter 2016 had 53%!

There were four brief spells of rain this winter, none with heavy rain. They were spaced about seventeen days apart. That sequence had begun in autumn, with heavier falls then. After the 4th of August there was no rain at all.

The total rainfall of 89.8 mm was at the 27th percentile, well below the winter average of 125 mm. Five recent winters had similar amounts of rain: 2000 (98 mm), 2001 (107 mm), 2003 (102 mm), 2004 (97 mm) and 2006 (104 mm). Two were much drier: 2002 (44 mm) and 2011 (55 mm).

Climate for winter 2017


Data. A Bureau of Meteorology automatic rain gauge operates in the museum yard. From 17 March 2017, 9 am daily readings are published as Manilla Museum, Station 55312.  These reports use that rainfall data when it is available. All other data, including subsoil at 750 mm, are from 3 Monash Street, Manilla.

August 2017 arid and sunny

Photo of a honey-eater feeding

Noisy Miner in Emu Bush

Very few days in August were cloudy, and only one day, the 4th, had some rain: 13.6 mm. Extremely dry air produced a 21st-century record low dew point of minus 10.0 degrees on the 20th. The dry air and clear skies dried out the soil, and also made for wide ranges of temperature. Twelve days were more than 20° warmer than their nights. The actual temperatures, however, were not extreme. Weekly average temperatures remained normal until falling to 3.3° lower in the final days.
Frosts (below +2.2° in the screen) happened on 17 mornings, just two more than normal.

Weather log

Comparing August months

Arid August months like this occurred in 2012 and 2013, but not since then. The mean early morning dew points in 2012 (-2.2°) and this time (-2.8°) were record values, far below the normal value of +2.2°. This month was also very sunny, had little rain, and had a daily temperature range of 17.9°, a record for August.
Temperatures were close to normal. The daily maximum (19.8°) was a degree above normal, and the daily minimum (1.9°) was a degree below normal.
The total rainfall of 13.8 mm (20th percentile) was far below the August average (40 mm). Added to the low total for July (13.2 mm), the two-month total is only 27.0 mm, which is at the 6th percentile. That makes it the first serious rainfall shortage of any duration since October 2015, when the 30-month total had been at the 6th percentile. For two-month rainfall totals, there has not been such a shortage since nearly four years ago (September 2013).

Climate graph for August


Data. A Bureau of Meteorology automatic rain gauge operates in the museum yard. From 17 March 2017, 9 am daily readings are published as Manilla Museum, Station 55312.  These reports use that rainfall data when it is available. All other data, including subsoil at 750 mm, are from 3 Monash Street, Manilla.