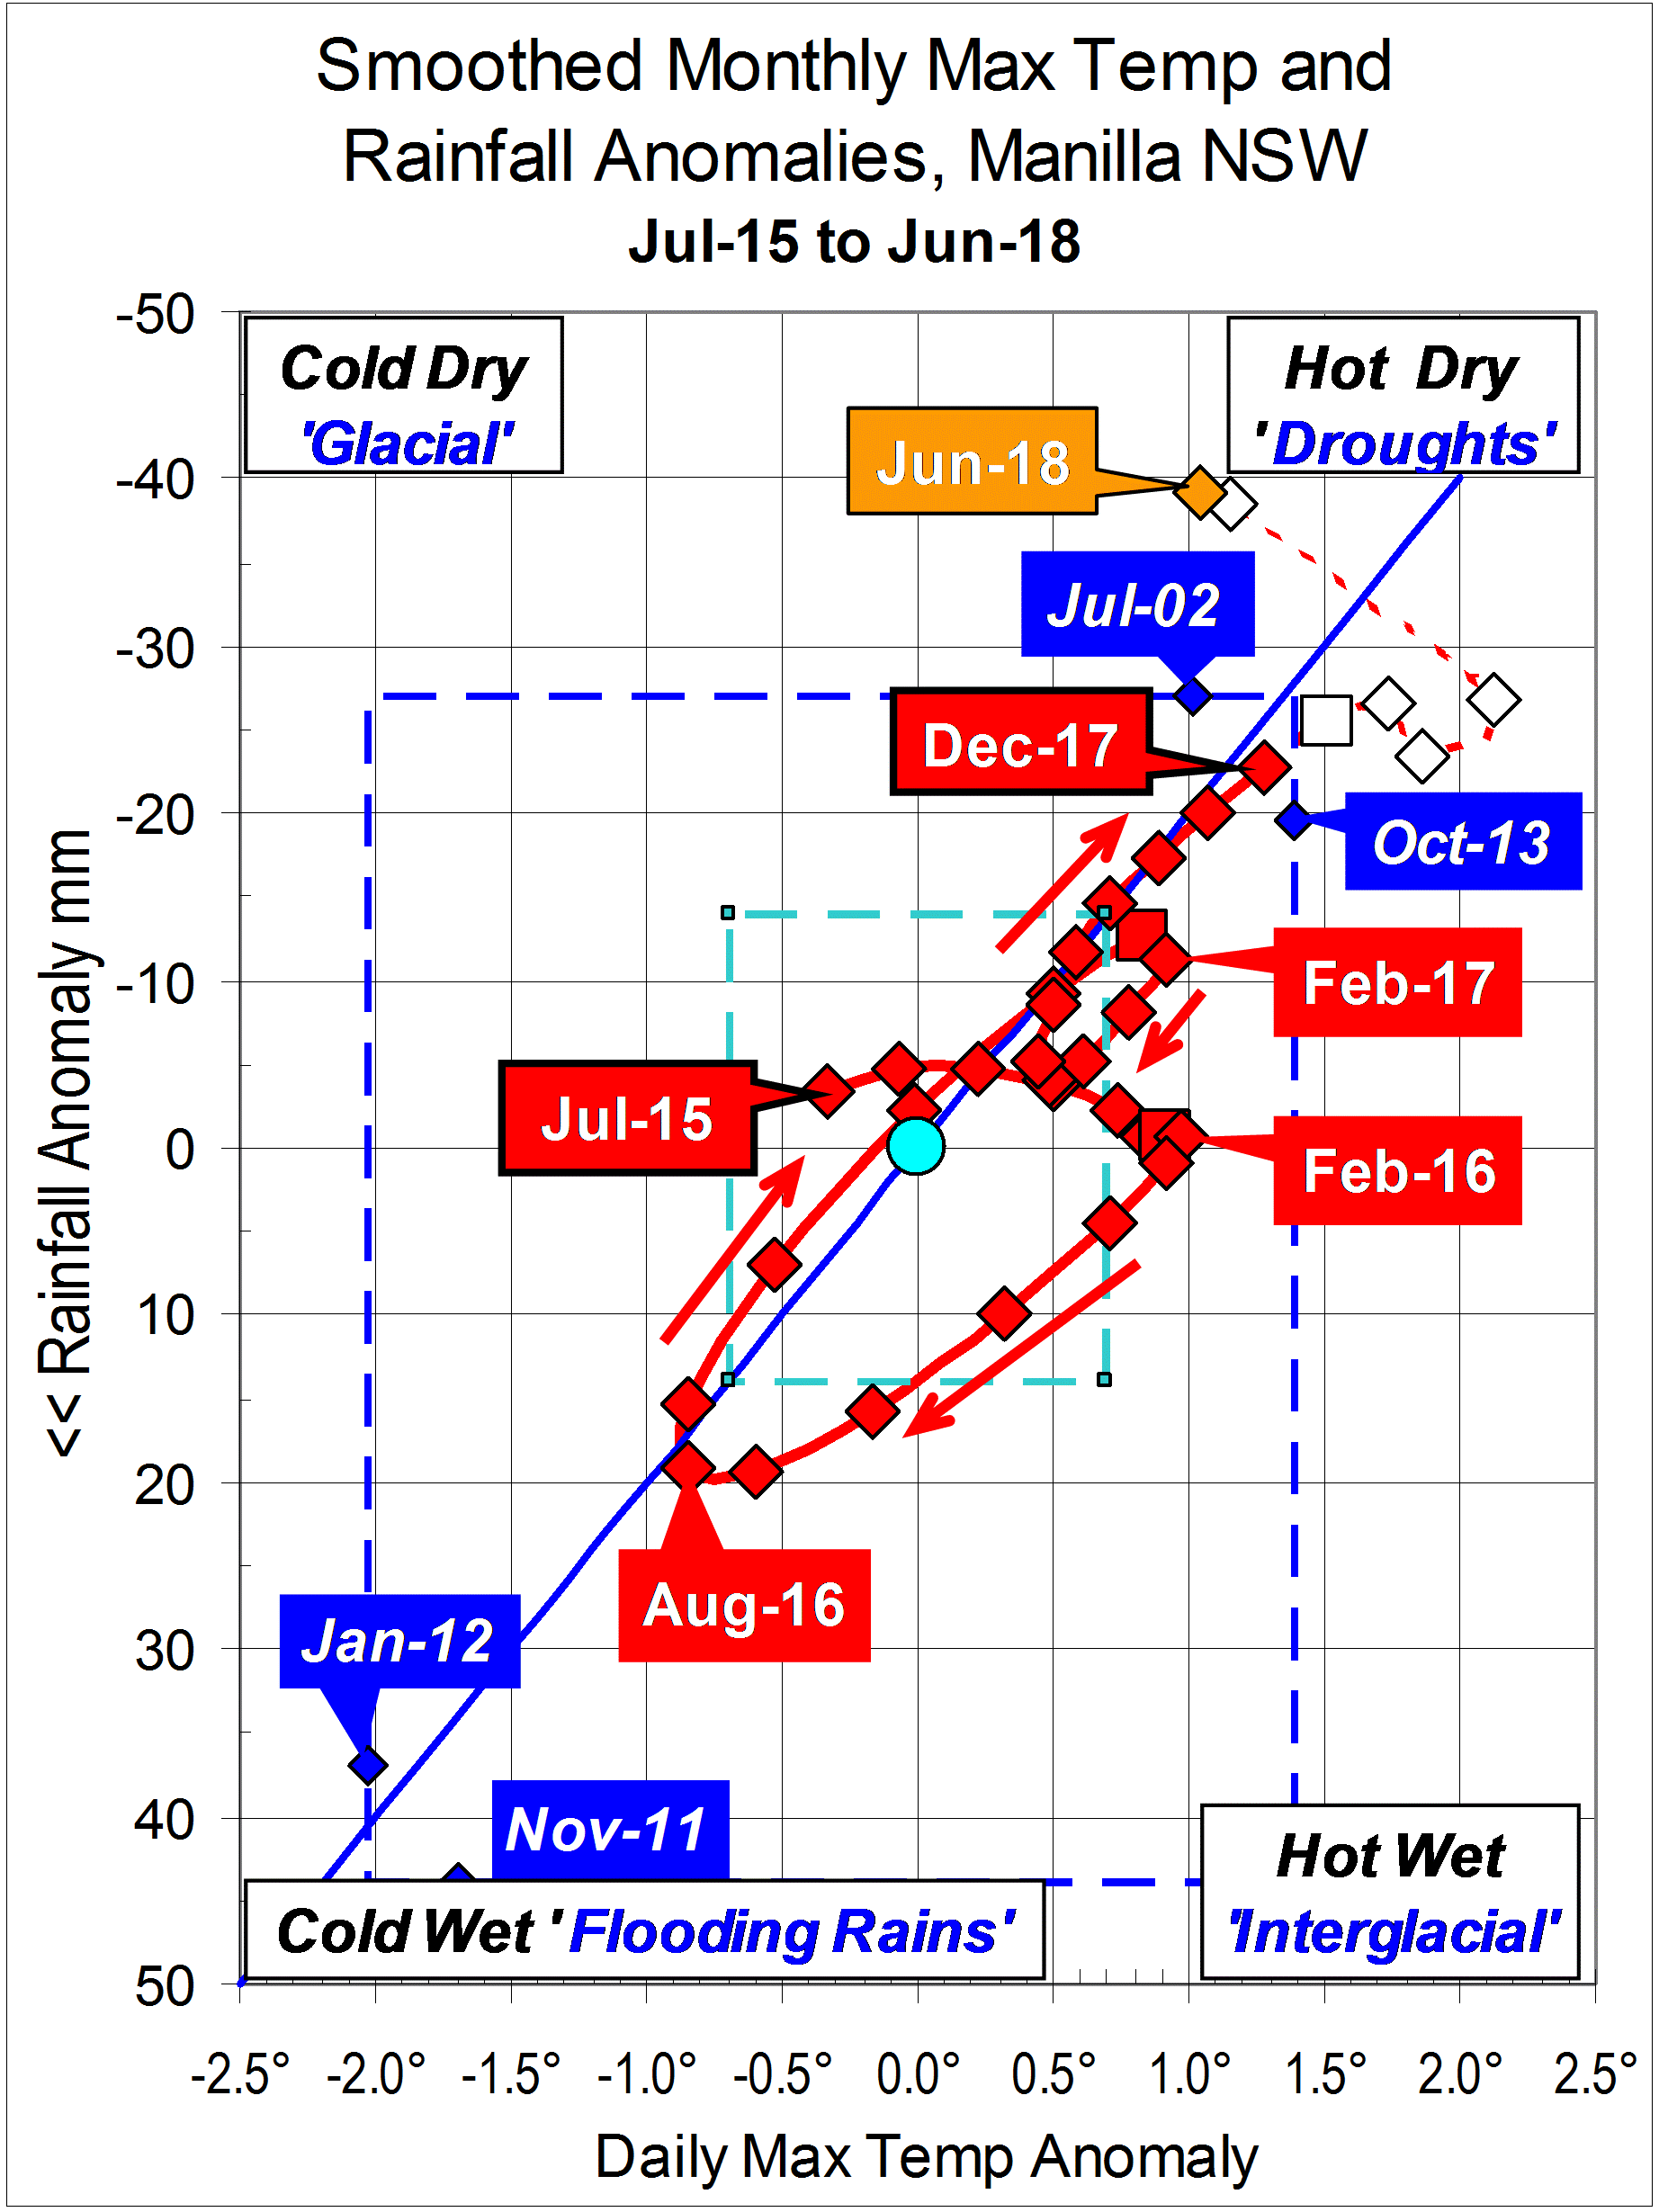
A parametric plot relating smoothed monthly rainfall anomaly versus smoothed daily maximum temperature anomaly for three years ending June 2018 at Manilla NSW.

A parametric plot relating smoothed monthly rainfall anomaly versus smoothed daily maximum temperature anomaly for three years ending June 2018 at Manilla NSW.
