The Adaptive Comfort Standard of ASHRAE
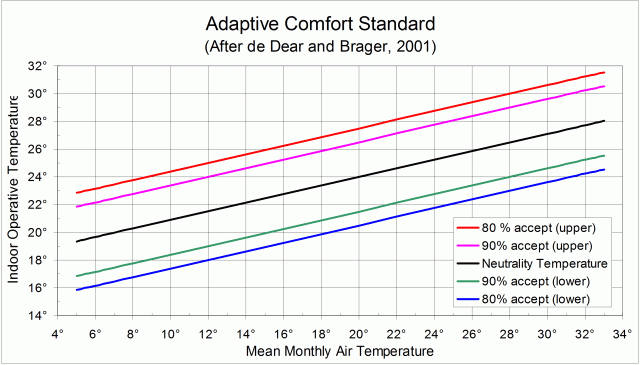
You need to know what range of temperature you are likely to find comfortable when you are planning a house or its heating and cooling. This graph is a guide to the temperature range for comfort.
The graph explains itself. People are comfortable at rather higher temperatures in places, or at times of year, when the climate is warmer. They are comfortable at lower temperatures if the climate is cooler.
For any month in any place, you must simply look up the mean temperature for that month. Then 90% of all people will feel comfortable at temperatures in the five-degree range between the magenta line and the green line. At temperatures in the seven-degree range between the red and blue lines, 80% of people will feel comfortable.
Generally, using the local mean temperatures for January and July will give enough information for your planning. Sydney provides an example:
Because the Sydney mean temperature in the coldest month, July, is 13°, 80% of people will remain comfortable if a house gets no colder than 18°.
Because the Sydney mean temperature in the hottest month, January, is 23°, 80% of people will remain comfortable if a house gets no hotter than 29°.
The adaptive comfort zone shown on the graph was proposed by Richard de Dear and Gail Schiller Brager (2001).
This adaptive comfort zone has been incorporated in the de facto international standard: ANSI/ASHRAE Standard 55-2004, Section 5.3,, as summarised here.
By this innovation, the American Society of Heating, Refrigeration, and Air-conditioning Engineers (ASHRAE) recognised publicly that full climate control of buildings at one “ideal” temperature and humidity may not be the way of the future.
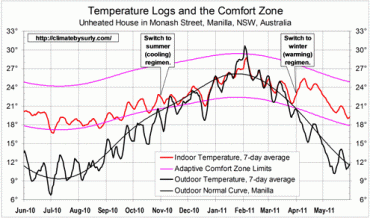
 I have used this Adaptive Comfort Standard in many of my posts, notably the one showing how my house maintained a temperature almost completely within the Comfort Zone through a whole year.
This material, with its graph, was posted originally to a “weatherzone” forum more than seven years ago. Unfortunately, the photo-hosting website “Photobucket” has now withdrawn the image from public use. This post is to make it available again.
In November 2019, the weatherzone forum was closed due to lack of public interest.

