Part 3 of 3: A growth and collapse model for summer rainfall
(See Notes below for data and plotting details.)
I have put this October 2014 post up on the front page as a “sticky” (5/1/15) because I have just found a relevant scientific article. See “Note added January 2015” below.
A linear trend
In Part II, I showed that a linear trend fits well (R-squared = 0.54) to smoothed summer rainfall at Manilla, NSW from 1897 to 1976. This trend-line rises extremely steeply: 156 mm per century.
(See also the Duodecadal Means graph below.)
Implications of the extreme trend
Such an extreme trend cannot extend more than a short time into the past or the future without reaching physical limits. Extremely high values must be followed by lower values and vice versa. The oscillation between higher and lower values in nature is often modeled as a smooth harmonic curve. That does not fit well here. Not only does the rise from 1897 to 1976 fail to curve down approaching the final peak, the falls from 1892 to 1900 and from 1975 to 1987 are extremely sharp. They are collapses.
It seems to me that a model of steady growth followed by sudden collapse may perhaps reflect the processes involved. On the graph I have added speculative trend lines of the same rising slope as that observed for 1897 to 1976. The constant for the first speculative trend line is 130 mm higher and leads to a 130 mm collapse from 1896 to 1899. A 90 mm collapse from 1978 to 1981 then leads to a renewed rising trend that is 90 mm lower.
Note added January 2015.
The sudden collapse in summer rainfall here at the beginning of the twentieth century was studied sixty years ago by E.B. Kraus (Snowy Mountains Authority!): “Secular changes of east-coast rainfall regimes” (1955).
“The mean rainfall along the east coasts of North America and Australia is shown to have decreased abruptly at the end of the 19th century… A simultaneous decrease of the rainfall in the semi-arid western parts of New South Wales also conforms to conditions in other dry regions such as Arabia. In terms of seasons, the change appears to have been largest in autumn and summer for North America and in autumn and spring for Australia.” (Well, I observe it here in the summer half-year.)
Since Kraus wrote, an enormous amount has been learnt about the controls of Australian climate (ENSO, etc.). However, I doubt that major inter-decadal changes in rainfall regime are much nearer to being predicted.
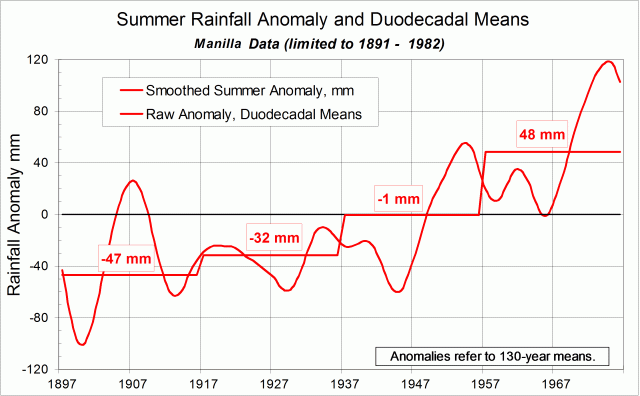
Duodecadal Means
To express this progressive rise in summer rainfall (1897-1976) differently, I add the graph below. Reports on global warming commonly use graphs showing that each decade’s average value is higher than the one before. Here, I have calculated duodecadal summer rainfall averages from the raw data. It is clear that each 20-year period is much wetter than the one before. In fact, the rise from one duodecade to the next increases: first 15 mm, then 31 mm, and 49 mm. (Decade averages are not shown, as each second value steps down.)
Posts on this topic
This post is one of three on “Decadal and Inter-decadal changes in rainfall” based on the 130-year rainfall record at Manilla, NSW, Australia:
I: The whole 130-year record.
II: The record restricted to 1891-1982 (92 years).
III: A growth and collapse model for summer rainfall. (This post.)
Notes
Rainfall at Manilla, NSW, has been observed since 1883. As I posted earlier, there are two distinct rainfall modes, centred on the summer and winter solstices. The summer (monsoon) mode has nearly twice the rainfall of the winter (westerly) mode.
Here, I have assigned to the winter mode the monthly data from April to September, and assigned to the summer mode the monthly data from October, extending to March in the following year.
Each data value has been expressed as an anomaly from the 130-year mean. I found the anomalies not only for the “summer” and “winter” totals, but also for their sum (April to March) and their difference (summer minus winter). To remove high-frequency noise and the effect of ENSO from the plotting, I applied a Gaussian filter of half-width 6 years.


Interesting to see the saw tooth wave form in your time series surly. Keep up your most excellent work ‘surly’ Top stuff
It is speculative, Crikey. In a decade or so we’ll see how the new trend is going. As for the 19th century trend, there are a few stations going back before 1880. I am not sure that I have found them all yet. Blair Trewin informed me of some of them. Do you have a list?
Pingback: RAINFALL .. TIME SERIES ..GRAPHED | CRIKEY !#&@ ...... IT'S THE WEATHER CYCLES